
In order to bring you our list of top 20 best cities for startups and entrepreneurs, we analyzed relevant data of the country’s 50 most populous urban centers. Because scale is in itself a factor, we also grouped cities by population brackets. This week we bring you our findings for each separate group of top cities for startups in the U.S.:
- Top 10 startup cities with population above 1 million,
- Top 10 startup cities with population between 500,000 and 1 million,
- Top 10 startup cities with population below 500,000.
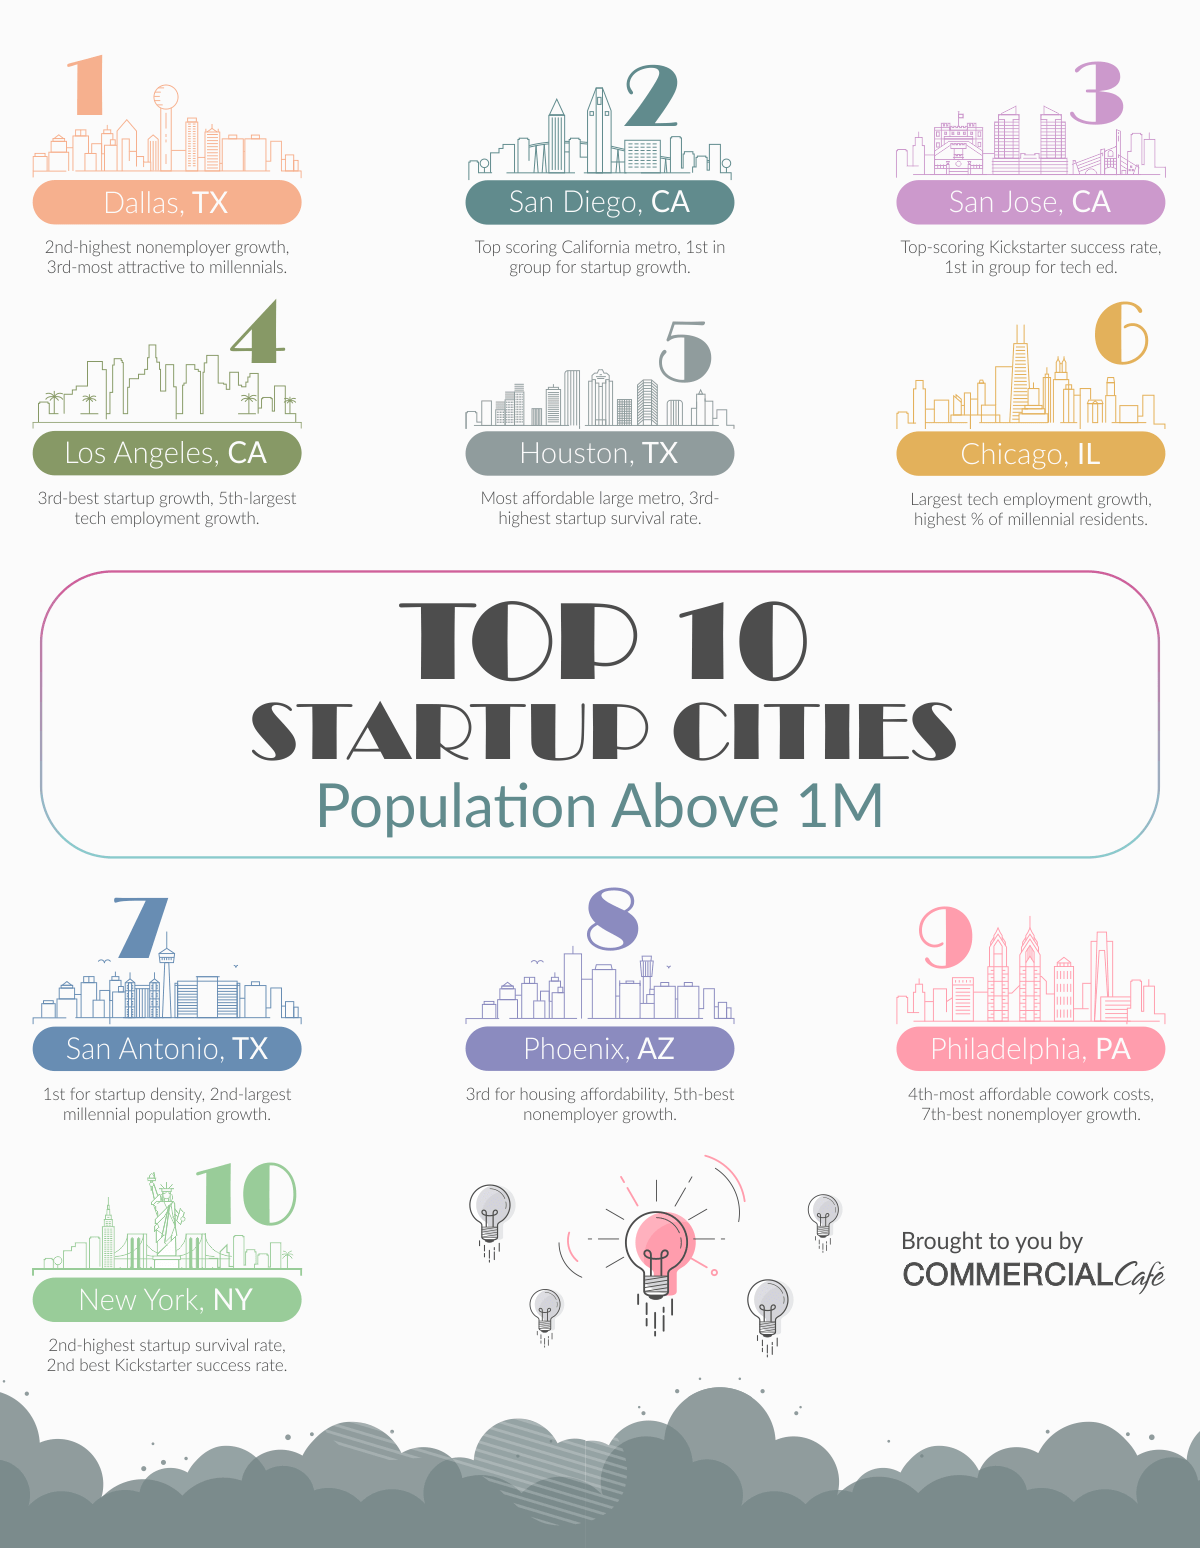
Top Cities for Startups in the U.S. – Population Above 1M
Texas and California each have three entries in this group, almost all huddled together in the top spots. Among cities with population larger than 1 million, Dallas ranked best, followed by California’s San Diego, San Jose, and Los Angeles. Houston rounded out the top five, followed by Chicago in sixth place. San Antonio came in seventh, with Phoenix, Philly, and NYC filling in the final three spots.
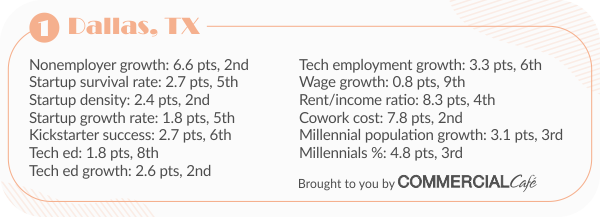
Dallas, TX
Dallas ranked 15th on our previous list of top cities for startups in the U.S., but now tops the list of best startup cities with population above 1 million. In this top 10, Big D ranked second, after Houston, for cowork cost affordability; second for tech ed growth, after San Jose, CA; second for nonemployer growth, after San Diego; and second for startup density, after Texas’ own San Antonio. Among similarly sized cities, Dallas came in third-most attractive to millennials and is also home to the third-largest millennial population bracket. For housing affordability, Dallas ranked fourth-best, after Phoenix, San Antonio, and Houston.
Looking for local flexible workspace options? You can quickly and easily discover the best coworking space in Dallas for your needs, with CommercialCafe.com!
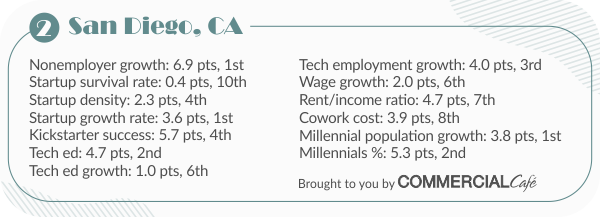
San Diego, CA
San Diego was the best scoring California city with a population larger than 1 million. Among similarly sized urban centers, the Plymouth of the West ranked first for growth in millennial population, first for startup growth, and first for nonemployer growth. San Diego came in second for tech education and third for tech employment growth. Not at all bad for a long-time military town that has successfully diversified its economy to include industries like biotechnology, telecommunications, and tourism.
Looking for local flexible workspace options? You can quickly and easily discover the best coworking space in San Diego for your needs, with CommercialCafe.com!
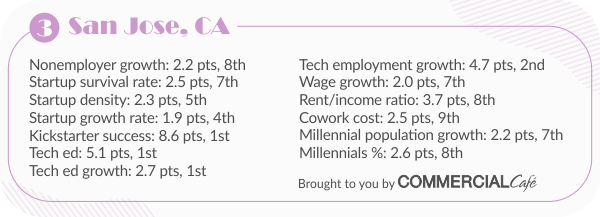
San Jose, CA
Although the Northern California tech hub did not make the overall top 20 ranking, it did quite well within its class. Home to the largest percentage of Kickstarter success stories, San Jose also ranked first in group for tech education and for tech education growth. For tech employment growth, the city ranked second behind Chicago. The city’s next-best ranking factors were startup growth rate (fourth) and startup density (fifth) among cities with population above 1 million. San Jose was the seventh-most attractive to millennials and ranked eighth for nonemployer growth.
Looking for local flexible workspace options? You can quickly and easily discover the best coworking space in San Jose for your needs, with CommercialCafe.com!
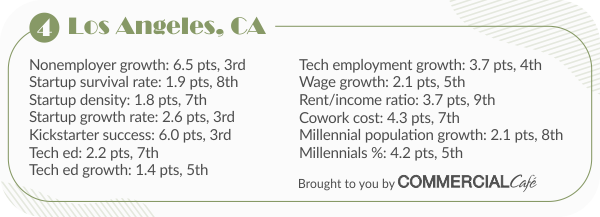
Los Angeles, CA
L.A.’s top-ranking metrics landed third in group: third-highest startup growth rate, third-best nonemployer growth, and third-best Kickstarter success rate. Los Angeles ranked fifth among the country’s largest cities for tech education growth and for tech employment growth. The City of Angels boasts the seventh-largest percentage of the population with a higher education certification in a tech discipline. L.A. also landed seventh in this top 10 for startup density and for affordability of monthly cowork costs.
Looking for local flexible workspace options? You can quickly and easily discover the best coworking space in Los Angeles for your needs, with CommercialCafe.com!
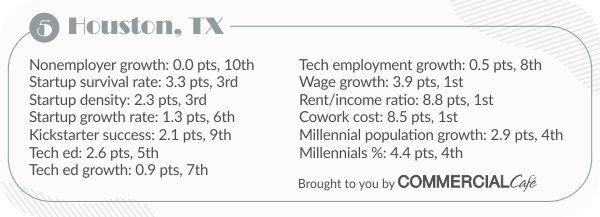
Houston, TX
Space City ranked first for affordability of housing and cowork costs as well as for affordability of labor, having seen the slowest five-year tech wage increase out of the million+ population cities on our list. Houston ranked third in group for startup density and for startup survival. The city is home to the fourth-largest percentage of millennial residents out of the total population, and saw the fourth-largest growth in number of millennial residents. Houston ranked fifth in group for the share of population holding a bachelor’s degree or higher in a tech discipline. The rate at which the number of such residents has increased placed Houston seventh for tech education growth.
Looking for local flexible workspace options? You can quickly and easily discover the best coworking space in Houston for your needs, with CommercialCafe.com!
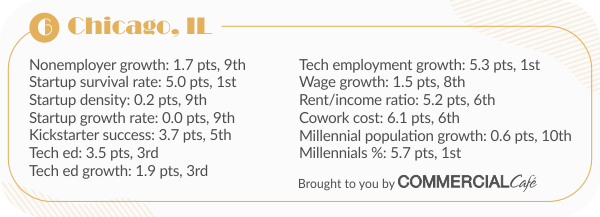
Chicago, Il
The data we analyzed showed that Chicago saw the largest tech employment growth and its economy nurtured the highest startup survival rate. Among cities with population above 1 million, Chicago is home to the largest share of millennial residents. The City of the Big Shoulders also bears a strong tech education inclination, ranking third for share of residents holding science and engineering bachelor’s degrees or higher, as well as the third-highest growth in number of such residents. The cost of living metrics of affordability of housing and of affordability of cowork space in Chicago ranked sixth.
Looking for local flexible workspace options? You can quickly and easily discover the best coworking space in Chicago for your needs, with CommercialCafe.com!
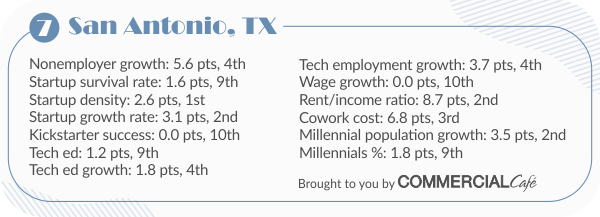
San Antonio, TX
The third Texas city in this top 10, San Antonio scored the most points for startup density, a metric for which it is on par with its smaller neighbor to the north. Among similarly sized cities, the City of the Alamo ranked second for startup growth rate, behind San Diego, and showed the second-largest increase in number of millennial residents. San Antonio fared well in terms of cost of living, landing second for housing affordability and third for cowork costs. The increase in number of tech jobs placed the city fourth for tech employment growth. San Antonio also ranked fourth for tech ed growth as well as increase in number of nonemployer firms.
Looking for local flexible workspace options? You can quickly and easily discover the best coworking space in San Antonio for your needs, with CommercialCafe.com!
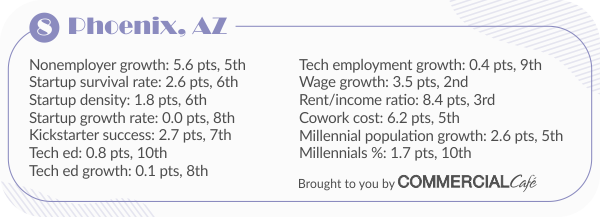
Phoenix, AZ
Phoenix’s best ranking metric was talent affordability, with the second-slowest tech wage increase on our list, behind Houston. The city also fared well for living costs, coming in third for affordability of housing and fifth for cowork cost. Phoenix also saw the fifth-largest growth in number of millennial residents among the country’s largest urban centers. The local entrepreneurial community saw the fifth-best nonemployer growth, while the startup density and startup survival rate both landed Phoenix in sixth place.
Looking for local flexible workspace options? You can quickly and easily discover the best coworking space in Phoenix for your needs, with CommercialCafe.com!
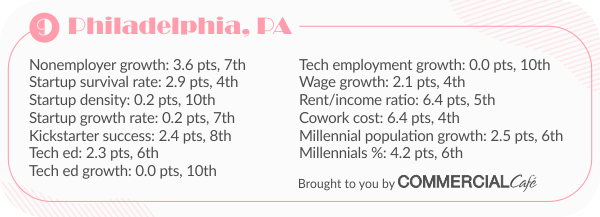
Philadelphia, PA
Philadelphia landed ninth on our list of top cities for startups in the U.S. with a population above 1 million. Affordability of cowork space in Philadephia and housing ranked fourth and fifth, respectively. Wages for computer, mathematical, architecture, and engineering occupations in Philly saw the fourth-slowest increase, after NYC, Phoenix, and Houston. Although local startup density ranked tenth, the data showed Philadelphia had the seventh-largest startup growth rate and the fourth-best startup survival rate. The increase in number of one-person enterprises placed Philly seventh for nonemployer growth.
Looking for local flexible workspace options? You can quickly and easily discover the best coworking space in Philadelphia for your needs, with CommercialCafe.com!
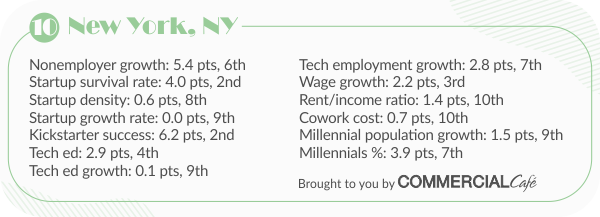
New York, NY
In all its hustling and bustling complexity, New York City still has room to grow for entrepreneurs and rounds out this top ten. While the city ranked eighth for startup density and ninth for startup growth rate, NYC’s startup survival rate ranked second in group. Nonemployer growth landed New York in sixth place. The city came in tenth in terms of the living cost metrics we factored in, with average housing and cowork costs combined accounting for an estimated 43% of the median income for computer, mathematical, architecture, and engineering occupations. Wages in these occupations have seen the third-slowest increase in NYC, compared to the other million+ population cities on our list.
Looking for flexible workspace options in New York? You can quickly and easily discover the best coworking space in Mahattan for your needs, as well as Brooklyn coworking space listings and more, with CommercialCafe.com!
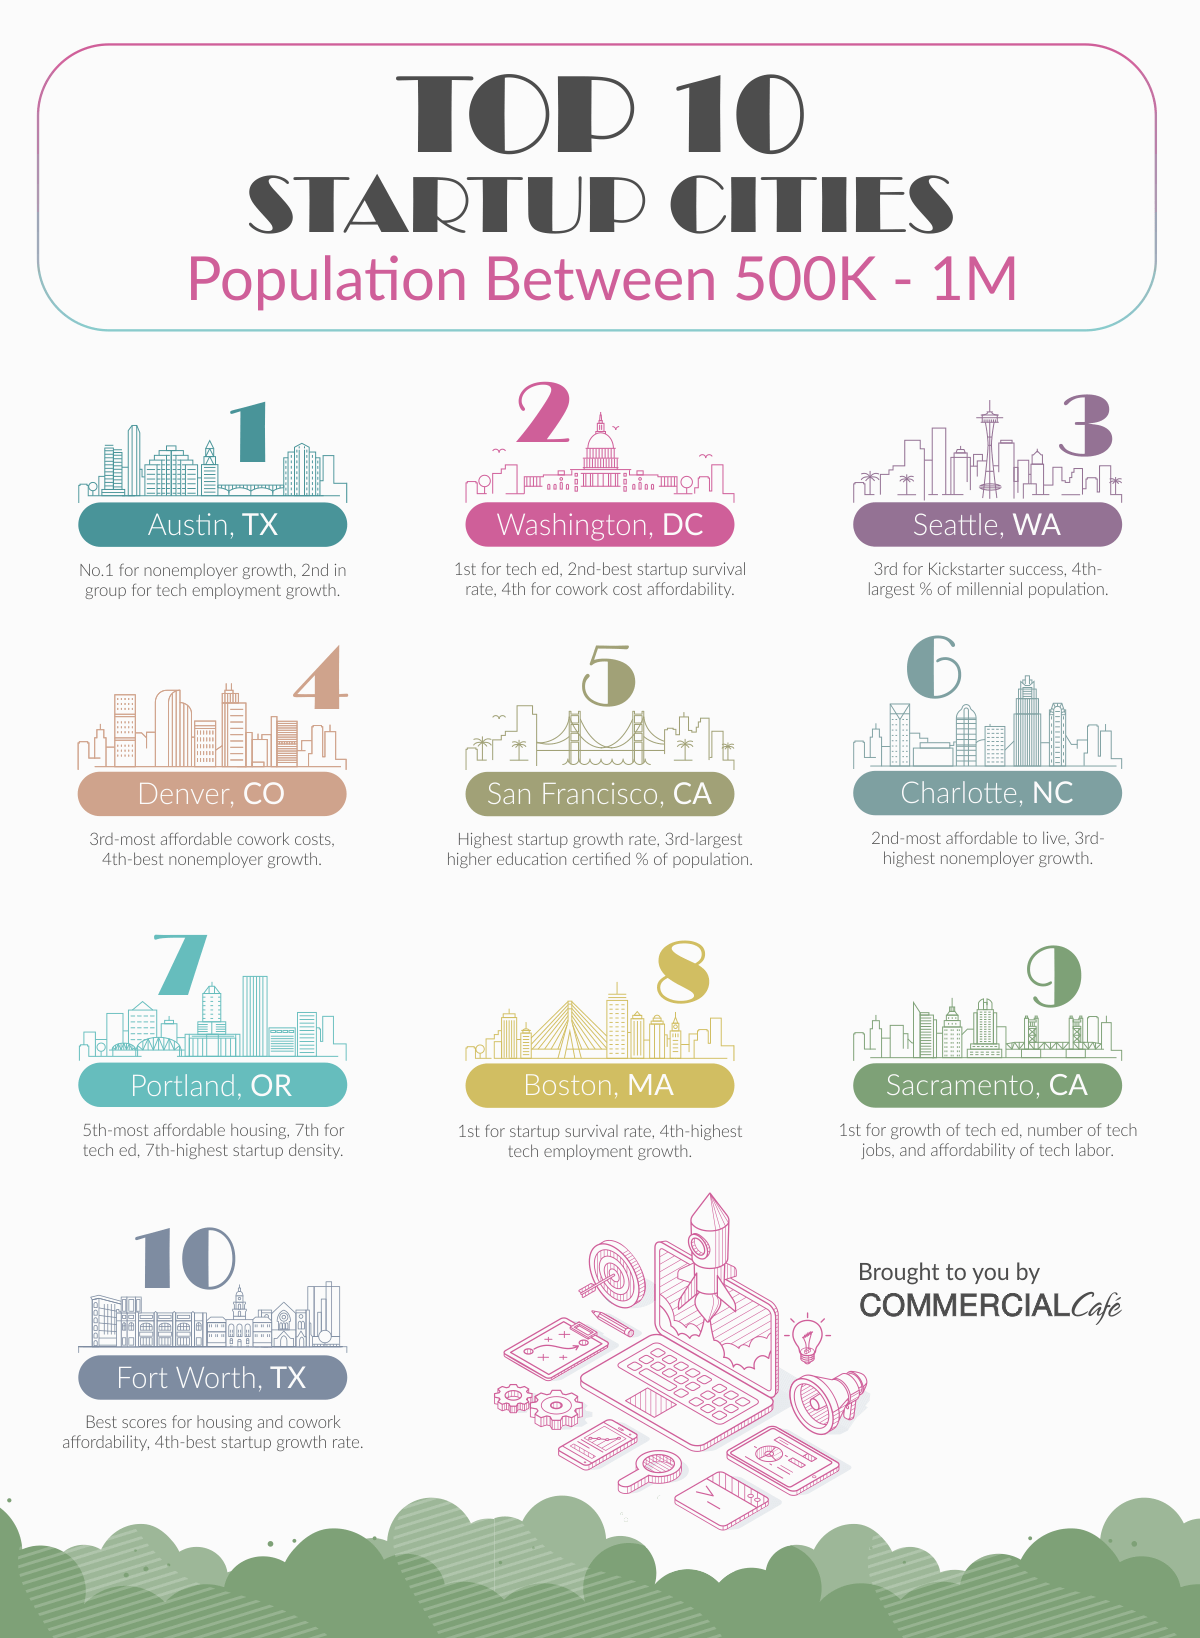
Top Cities for Startups in the U.S. – Population Between 500K and 1M
All ten entries presented in this section also made the cut in our overall top 20 ranking, but you’ll find they ranked differently for some metrics when compared only to similarly sized cities. Austin took the top spot within its population bracket, followed by Washington D.C. in second place and Seattle in third. Denver placed fourth, just ahead of San Francisco, which rounded out the top five. Charlotte came in sixth, followed by Portland. Boston got the eighth-best score in group, with Sacramento ninth, and Fort Worth closing out this top 10.
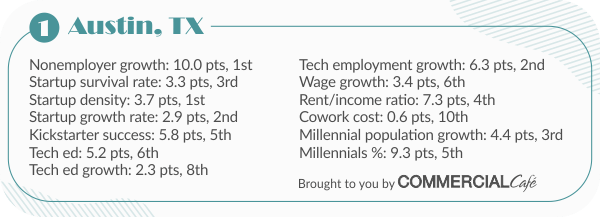
Austin, TX
Texas’ capital landed the top spot on our list of 10 best U.S. cities for startups and entrepreneurs between 500K and 1 million people. Boasting the highest startup density and nonemployer growth as well as the second-highest startup growth rate and tech employment growth. While it ranked fourth-in-group for housing affordability, Austin came in tenth for most affordable in average cowork cost.
Looking for local flexible workspace options? You can quickly and easily discover the best coworking space in Austin for your needs, with CommercialCafe.com!
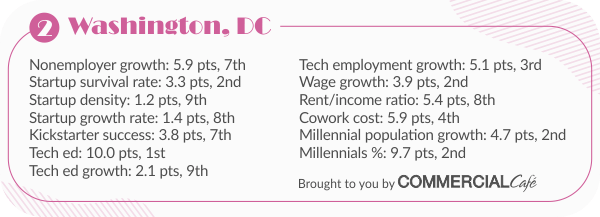
Washington, DC
D.C. ranked among the top five for most ranking factors. The city scored first, both in group and nationwide, for being home to the highest percentage of tech educated people. Washington was second in group for both percentage of millennial residents out of the total population and growth rate, second for startup survival rate (was fifth in the overall top 20), and second-slowest wage growth in computer, mathematical, architecture, and engineering occupations. The 30% increase in number of industry jobs placed D.C. third for tech employment growth, two positions up compared to the top 20 standing.
Looking for local flexible workspace options? You can quickly and easily discover the best coworking space in Washington, D.C., for your needs, with CommercialCafe.com!
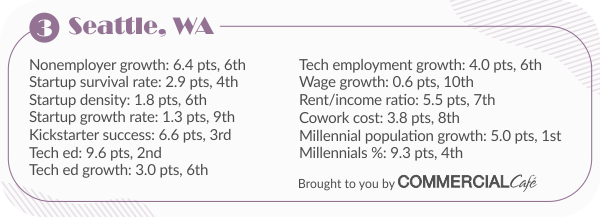
Seattle, WA
The Emerald City saw the biggest increase in number of millennial residents and is home to the second-largest share of tech educated population with 11.5% holding a science and engineering bachelor’s degrees or higher. The 63.3% Seattle startup survival rate placed the city fourth-in-group for this metric, a four-position climb compared to the overall top 20. Seattle came in third both among the 20 top cities for startups in the U.S. and within its population bracket of between 500,000 and 1 million.
Looking for local flexible workspace options? You can quickly and easily discover the best coworking space in Seattle for your needs, with CommercialCafe.com!
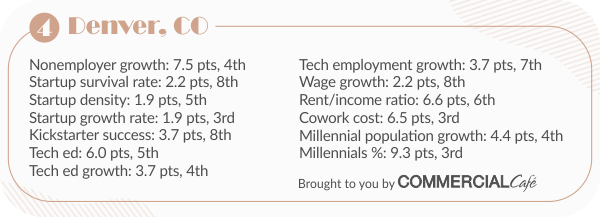
Denver, CO
The Mile High startup scene retained fourth place among cities in its population bracket based on its overall score. For average cowork cost, Denver ranked eighth in the top 20, but came in third among similarly-sized cities. Startup density placed Denver 12th overall, but fifth in group. The city also climbed from sixth-fastest startup growth rate in the original ranking to third-fastest in this top 10.
Looking for local flexible workspace options? You can quickly and easily discover the best coworking space in Denver for your needs, with CommercialCafe.com!
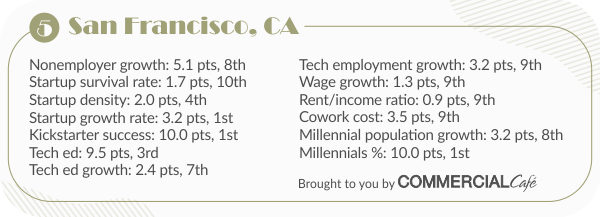
San Francisco, CA
San Francisco’s best ranking metrics among peer population cities were the share of millennial residents (highest nationwide) and the startup growth rate, which came in fourth in the top 20 ranking. 11.4% of residents aged 25 to 39 hold a science and engineering bachelor’s degree or higher, which placed S.F. third for tech ed in both rankings. The local startup density of 14.9% earned ninth spot in the top 20, but fourth in this top 10.
Looking for local flexible workspace options? You can quickly and easily discover the best coworking space in San Francisco for your needs, with CommercialCafe.com!
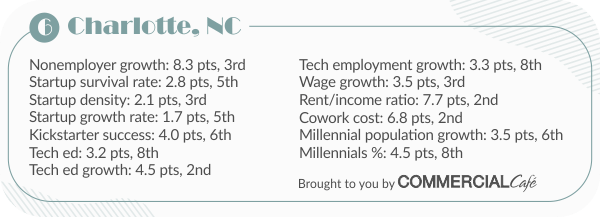
Charlotte, NC
Charlotte saw the second-highest tech ed growth between 2013 and 2017 both in the overall ranking and within its population bracket. Cost of living metrics (affordability of housing and of cowork cost) ranked seventh in the top 20, but climbed to second spot in this top 10. Growth in number of solo businesses ranks third among similarly sized cities, one position higher than in the top 20. On this chart, Charlotte’s startup density climbs to third place from eighth, and the startup survival rate and startup growth rate take the fifth spot, up from nine and 10, respectively.
Looking for local flexible workspace options? You can quickly and easily discover the best coworking space in Charlotte for your needs, with CommercialCafe.com!
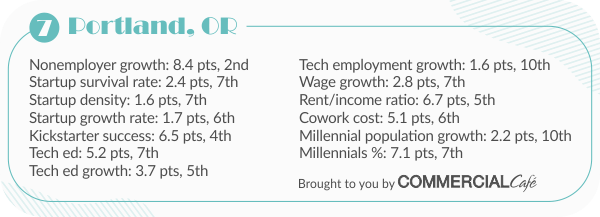
Portland, OR
Portland’s highest-ranking metric remained nonemployer growth, for which the city came in second-in-group. Compared to cities within its population bracket, Portland was fifth for housing affordability, a hefty climb from the 11th spot it held in our original ranking. The city also fared much better for tech ed growth, landing fifth-in-group compared to 15th in the overall top 20. Portland ranked sixth for cowork cost affordability, and seventh for tech ed, startup density, and startup survival rate.
Looking for local flexible workspace options? You can quickly and easily discover the best coworking space in Portland for your needs, with CommercialCafe.com!
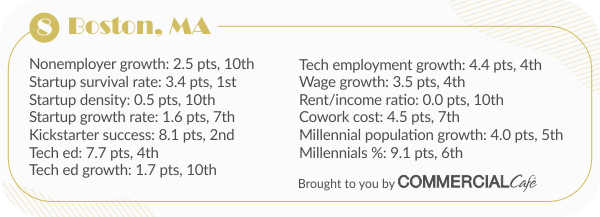
Boston, MA
Boston took the lead for startup survival rate in this ranking. Being an already established and highly competitive startup hub, Boston came in tenth for startup density and nonemployer growth. The startup growth rate, however, came in seventh, six positions higher than in the overall top 20 ranking. Higher education degree attainment by nearly 10% of the population and tech employment growth of 26% landed Boston fourth in group for both metrics. Last but not least, among cities with population between 500,000 and 1 million, Beantown was the sixth-most attractive to millennials.
Looking for local flexible workspace options? You can quickly and easily discover the best coworking space in Boston for your needs, with CommercialCafe.com!
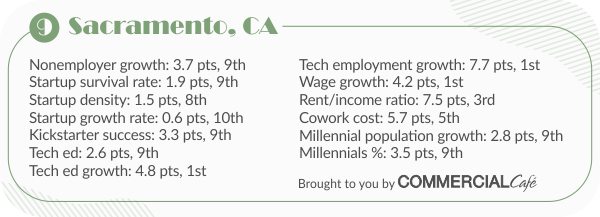
Sacramento, CA
The capital of the Golden State has a lot of talent to offer entrepreneurs who are building a business in tech. The city ranked first for tech employment growth and for growth in number of residents with a bachelor’s degree or higher in a science and engineering discipline. Sacramento also presents well in terms of talent affordability, landing first for wage growth, which is the slowest median wage increase for computer, mathematical, architecture, and engineering occupations. Living cost metrics also paint Sacramento an encouraging color as the third-most affordable housing and fifth-most affordable cowork cost market.
Looking for local flexible workspace options? You can quickly and easily discover the best coworking space in Sacramento for your needs, with CommercialCafe.com!
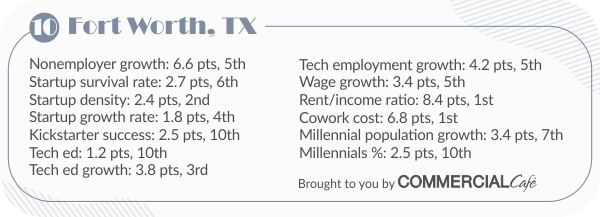
Fort Worth, TX
The Western half of Texas’ most famous metroplex overtook Dallas in the overall top 20 ranking of cities for startups in the U.S. Among urban centers with population between 500,000 and 1 million, Fort Worth ranked first for affordability of housing and of average monthly cowork cost. The city ranked third for tech ed growth with a 13.2% increase in the number of residents aged 25 to 39 that held a bachelor’s degree or higher in a science and engineering discipline. As the local administration pursued a more diverse economy, the number of jobs in computer, engineering, and science occupations increased 25% placing Fort Worth fifth for tech employment growth.
Looking for local flexible workspace options? You can quickly and easily discover the best coworking space in Fort Worth for your needs, with CommercialCafe.com!
Top Cities for Startups in the U.S. – Population Below 500K
The top 10 cities for startups in our smaller population bracket include the country’s most (still) affordable cities in which to live and start a business, and which have a budding entrepreneurial scene and diversifying economies. Atlanta topped the list in this category. Kansas City took second place, followed by Minneapolis and Oakland. Raleigh wrapped up the top five. Texas’ entry on this list is Arlington, in sixth place. Long Beach got the seventh-best score and Miami came in eighth. Wichita and Mesa landed ninth and tenth best, respectively.

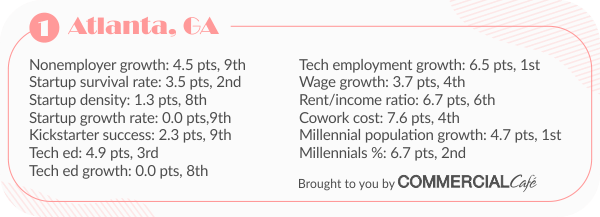
Atlanta, GA
Atlanta lands in the top position among the cities in our smaller population bracket. The city scored best-in-group for growth in tech employment and in millennial population. “The A” came in third in its group for Tech Ed, a significant climb compared to the city’s 10th place in the overall ranking. In our overall rankings, the city came in first for startup survival rate. Within its population bracket, however, Atlanta was overtaken by Miami, which had not made the cut in our initial top 20 ranking.
Looking for local flexible workspace options? You can quickly and easily discover the best coworking space in Atlanta for your needs, with CommercialCafe.com!
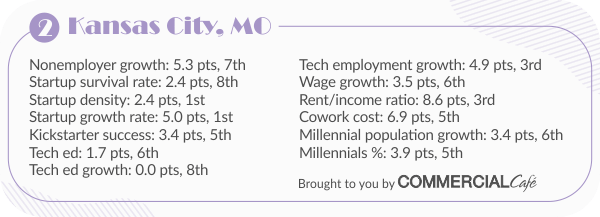
Kansas City, MO
Kansas City scored best-in-group for startup density and for startup growth rate. While the city ranked sixth nationally for tech employment growth, it came in third among cities with population below 500,000, immediately behind Atlanta and Mesa. Tech Ed is another aspect for which Kansas City ranked very well here, sixth in group, as opposed to 18th in the overall ranking. Kansas City boasted the third-best rent-to-income ratio in its population bracket group and in the top 20.
Looking for local flexible workspace options? You can quickly and easily discover the best coworking space in Kansas City for your needs, with CommercialCafe.com!
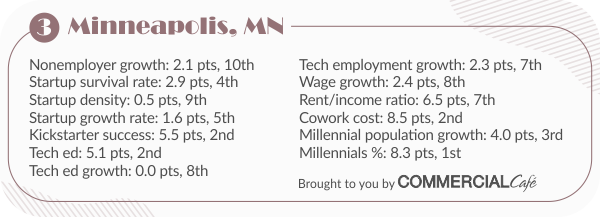
Minneapolis, MN
While the city came in ninth for Tech Ed nationwide, it settled in spot number two in this grouping, second only to Raleigh. The 63.4% startup survival rate places Minneapolis seventh nationwide, but fourth in this group. The vibrant Midwest startup hub ranked sixth-most attractive to millennials in our overall top 20, but number three within this population bracket. With millennials accounting for 30.3% of residents, Minneapolis is first for millennial percentage among U.S. cities with population below 500,000.
Looking for local flexible workspace options? You can quickly and easily discover the best coworking space in Minneapolis for your needs, with CommercialCafe.com!
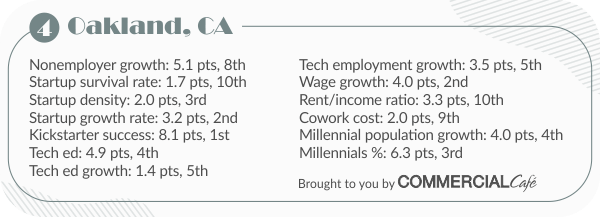
Oakland, CA
The startup growth rate in Oakland ranked third nationwide, but climbed one spot when comparing it to similarly sized cities. For startup density, Oakland placed third in group, a notable difference compared to ranking 10th in our all-cities-considered top 20. The city ranked 12th for tech employment growth nationwide, but fifth in group, just behind Long Beach. For tech ed, Oakland was fourth among cities in this population bracket, compared with 11th nationwide, which is still notable. The 12.9% growth in millennial population over five years secured Oakland fourth place among its population bracket peers.
Looking for local flexible workspace options? You can quickly and easily discover the best coworking space in Oakland and the East Bay area for your needs, with CommercialCafe.com!
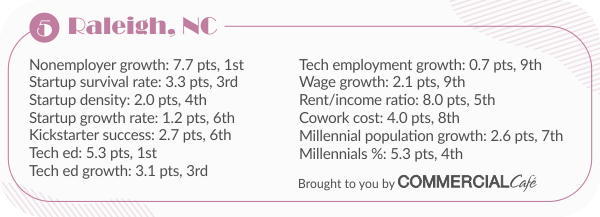
Raleigh, NC
Raleigh was first in nonemployer growth and tech ed for the group of cities with populations below 500,000. For these factors, the city ranked fifth and sixth, respectively, in our nationwide top 20. The tech ed growth of 10.7% over five years placed Raleigh third in group, three positions higher than in the overall ranking. Raleigh also ranked one position higher in the group than in the top 20 for startup survival rate, climbing to third from fourth. Among similarly sized cities, Raleigh climbed one spot for rent-to-income ratio and landed in the fifth position in this top 10, while it came in sixth for housing affordability in the overall top 20.
Looking for local flexible workspace options? You can quickly and easily discover the best coworking space in Raleigh for your needs, with CommercialCafe.com!
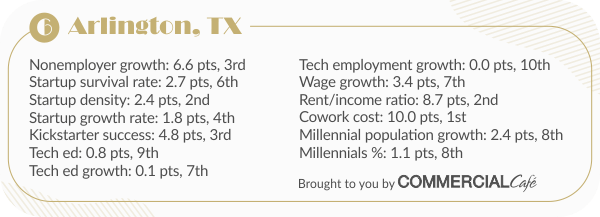
Arlington, TX
Arlington ranked first for coworking cost affordability both in the nationwide ranking and within this group. The city also ranks well for rent-to-income ratio on both lists. Arlington scored second-most affordable for housing among cities with population below 500,000, behind Wichita, which did not make the top 20. The 2.6% nonemployer growth landed Arlington third place in this population bracket. The metroplex Mid-City also ranked eighth for this nonemployer metric in our nationwide list of top cities for startups.
Looking for local flexible workspace options? You can quickly and easily discover the best coworking space in Arlington and the wider Mid-Cities area for your needs, with CommercialCafe.com!
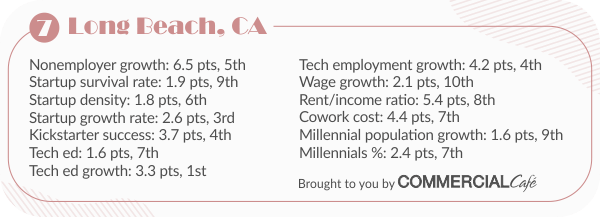
Long Beach, CA
While Long Beach did not make the national top 20, it landed seventh best startup city with population below 500,000. The city’s best-scoring metric was tech ed growth, placing first-in-group with an 11.5% five-year growth in amount of higher tech education-certified residents. We estimated that 2018 marked a 3.2% year-over-year increase in number of local startups, the third-highest startup growth rate in this category. Long Beach came in fifth both for nonemployer firm growth and fourth for tech employment growth, with a 25% increase in computer, engineering, and science jobs over five years.
Looking for local flexible workspace options? You can quickly and easily discover the best coworking space in Long Beach for your needs, with CommercialCafe.com!
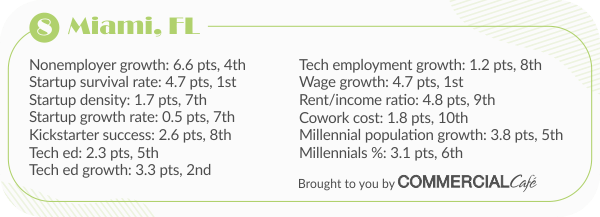
Miami, FL
Magic City ranks eighth among U.S. urban centers with population below 500,000. Miami landed top spot for startup survival rate and for slow wage growth. We estimated that in 2018, 69% of new firms with up to four employees remained active past their first year. According to the most recent BLS data, wages for computer, mathematical, architecture, and engineering occupations in Miami increased an average $575 in five years, marking the slowest wage growth in this group. With an 11.4% increase in the number of residents holding a Science and Engineering bachelor’s degree or higher, Miami came in second for tech ed growth.
Looking for local flexible workspace options? You can quickly and easily discover the best coworking space in Miami for your needs, with CommercialCafe.com!
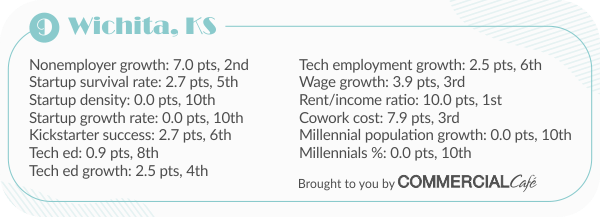
Wichita, KS
The ninth city in this population bracket actually ranked first for housing affordability, where the average rent accounted for just under 10% of the median local income for computer, mathematical, architecture, and engineering occupations. Number two for nonemployer growth with a 2.7% increase in number of nonemployer firms, the city also showed the third-slowest wage increase over the five years we analyzed. Wichita ranked third for cowork cost affordability and fourth for tech ed growth.
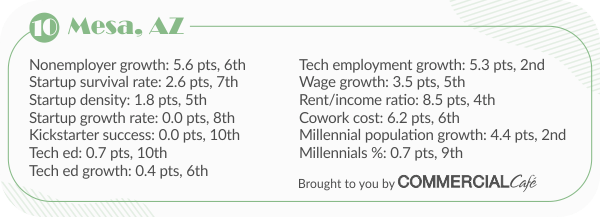
Mesa, AZ
Mesa rounds out the top ten cities with population below 500,000. The number of computer, engineering, and science jobs increased 31% over five years, landing the city second-in-group for tech employment growth. The local millennial stock saw the second-largest growth at 14.4%. Mesa placed fifth in this group for startup density in 2018, an estimated 14.6% of the city’s total businesses of up to four employees were in their first year of operation. Moreover, the cost of living in Mesa ranks among the more affordable with average housing and cowork costs combined accounting for 18% of the median income.
For those looking for great office deals, access to a reliable and up-to-date database of listings from all major U.S. markets is essential. Find the space that fits your business and investment needs with CommercialCafe.com:
Methodology
Considering the intense technologization of almost all economic sectors, we focused our analysis on metrics we deemed relevant to the success of early-stage tech startups. Data on nonemployer firms and startups with up to four employees is essential to gauging if and how well the local business environment encourages entrepreneurial activity. Kickstarter success rates can be corroborated with insufficient access to early stage funding at a local level. Stats on higher education attainment in the workforce are highly relevant to the depth of the local tech talent pool. Looking at tech employment trends helps determine the level of interest and demand in the industry locally.
We looked at industry wage growth and the share of housing rental and cowork cost out of the median industry income as factors relevant to cost of labor, important to the business owner, and cost of living, important to prospective employees. Millennials lead on adoption of new technology, creating not just most of the demand for new technology, but also the population bracket most likely to work in a tech industry. Therefore, we considered it to be highly relevant to look at the share of millennials out of total local population, as well as millennial population growth for each city.
Choosing the Cities
For this article, as well as for the previously published Top 20 ranking, we assigned composite scores based on several metrics to the 50 most populous U.S. cities for which data on all factors was available.* Population totals considered for city selection are according to U.S. Census estimates for 2017. This criterion was not factored into the scoring system, but was used to group cities for a better-focused comparative ranking. See the three tables below for the complete set of scores of each of the 30 cities.
The 30 cities ranked in this article are: Arlington, Texas; Atlanta, Ga.; Austin, Texas; Boston, Mass.; Charlotte, N.C.; Chicago, Ill.; Dallas, Texas; Denver, Colo.; Fort Worth, Texas; Houston, Texas; Kansas City, Mo.; Long Beach, Calif.; Los Angeles, Calif.; Mesa, Ariz.; Miami, Fla.; Minneapolis, Minn.; New York, N.Y.; Oakland, Calif.; Philadelphia, Pa.; Phoenix, Ariz.; Portland, Ore.; Raleigh, N.C.; Sacramento, Calif.; San Antonio, Texas; San Diego, Calif.; San Francisco, Calif.; San Jose, Calif.; Seattle, Wash.; Washington, D.C.; Wichita, Kan.
The complete list of 50 cities at which we looked for both articles is: Albuquerque, N.M.; Arlington, Texas; Atlanta, Ga.; Austin, Texas; Baltimore, Md.; Boston, Mass.; Charlotte, N.C.; Chicago, Ill.; Colorado Springs, Colo.; Columbus, Ohio; Dallas, Texas; Denver, Colo.; Detroit, Mich.; El Paso, Texas; Fort Worth, Texas; Fresno, Calif.; Houston, Texas; Indianapolis, Ind.; Jacksonville, Fla.; Kansas City, Mo.; Las Vegas, Nev.; Long Beach, Calif.; Los Angeles, Calif.; Louisville, Ky.; Memphis, Tenn.; Mesa, Ariz.; Miami, Fla.; Milwaukee, Wis.; Minneapolis, Minn.; Nashville, Tenn.; New Orleans, La.; New York, N.Y.; Oakland, Calif.; Oklahoma City, Okla.; Omaha, Neb.; Philadelphia, Pa.; Phoenix, Ariz.; Portland, Ore.; Raleigh, N.C.; Sacramento, Calif.; San Antonio, Texas; San Diego, Calif.; San Francisco, Calif.; San Jose, Calif.; Seattle, Wash.; Tucson, Ariz.; Tulsa, Okla; Virginia Beach, Va.; Washington, D.C.; Wichita, Kan.
*Although Fresno, CA meets the population total criterion, data availability was not consistent across all metrics considered for this study leading us to exclude it from the final list.
Metrics, Scores, and Points
For each metric, the number of maximum points was evenly distributed between the lowest and the highest metric values. On this scale, a score was calculated for each city based on its metric values. The factors (metrics) on which we based the composite scores are explained below. For rent burden, cowork cost, and average wage growth, the number of points awarded is inversely proportional to the metric values. For all other indicators, the number of points awarded is directly proportional to the metric values.
“Nonemployer growth” is based on U.S. Census Bureau data from 2012 through 2016 and tracks the average year-over-year growth in the percentage of tech businesses that have no employees and are subject to federal income tax. Data for this metric was only available at the metro level. Values scored represent a five-year trend and are expressed as percentages. The maximum weight for this metric is 10 points.
“Startup survival rate” refers to the percentage of new firms with up to four employees that made it through the first year of activity. We used the Microsoft Excel Forecast formula to estimate values for 2018/2017/2016/2015 based on the trend described by 2014 to 2010 U.S. Census Bureau data. Data for this metric was only available at the metro level. Values scored represent 2018 estimates and are expressed as percentages. The maximum weight for this metric is five points.
“Startup density” refers to the percentage of businesses that have been active for less than one year out of each city’s total businesses of up to four employees. We used the Microsoft Excel Forecast formula to estimate values for 2018/2017/2016/2015, based on the trend described by 2014 to 2010 U.S. Census Bureau data. Data for this metric was only available at metro level. Values scored represent 2018 estimates and are expressed as percentages. The maximum weight for this metric is five points.
“Startup growth rate” tracks the year-over-year change in the number of startups in each city. We used the Microsoft Excel Forecast formula to estimate values for 2018/2017/2016/2015 based on the trend described by 2014 to 2010 U.S. Census Bureau data. Data for this metric was only available at the metro level. Values scored represent 2018 estimates and are expressed as percentages. The maximum weight for this metric is five points.
“Kickstarter success” refers to projects that have reached their funding goals and unlocked their Kickstarter capital. For this study, we looked at the percentage of successful tech projects out of all Kickstarter tech projects in each city from 2009 through 2018. Values scored represent the success rate over the entire period. The maximum weight for this metric is 10 points.
“Tech ed” represents the percentage of a city’s population that holds a bachelor’s degree or higher based on 2017 U.S. Census Bureau data on Science and Engineering degrees for the population aged 25 to 39. Values scored represent 2017 data. The maximum weight for this metric is 10 points.
“Tech ed growth” represents the change in totals population that holds a bachelor’s degree or higher in Science and Engineering based on U.S. Census Bureau data from 2013 through 2017 for the population aged 25 and over in each city. Values scored represent a five-year trend and are expressed as a percentage. The maximum weight for this metric is five points.
“Tech employment growth” refers to computer, engineering, and science occupations, tracks job growth for each city based on U.S. Census Bureau data from 2013 through 2017 and is expressed as a percentage. Values scored represent a five-year growth rate. The maximum weight for this metric is 10 points.
“Wage growth” tracks the average year-over-year growth of the median income in each city based on U.S. Bureau of Labor Statistics data from 2013 to 2017 for “computer,” “mathematical,” “architecture,” and “engineering” occupations. Data on median income was only available at the metro level. Values scored represent a five-year average of wage growth. The maximum weight for this metric is five points.
“Rent/income ratio” refers to the average rent percentage in relationship to median income. The average rent for each city was calculated based on February 2019 Yardi Matrix rent data. Median income was calculated based on latest available U.S. Bureau of Labor Statistics data for “computer,” “mathematical,” “architecture,” and “engineering” occupations (2017) and adjusted for inflation. Data on median income was only available at the metro level. Values scored represent 2019 rent burden estimates. The maximum weight for this metric is 10 points.
“Coworking cost” represents the average monthly starting price for coworking time expressed as a percentage in relationship to median income. Coworking cost averages were based on March 2019 Regus online prices. Median income was calculated based on latest available (2017) U.S. Bureau of Labor Statistics data for “computer,” “mathematical,” “architecture,” and “engineering” occupations and adjusted for inflation. Data on median income was only available at the metro level. Values scored represent 2019 cowork cost burden estimates. The maximum weight for this metric is 10 points.
“Percentage Millennial” represents the percentage of millennials out of each city’s total population based on latest available U.S. Census Bureau data. Values scored are 2017 demographic percentages. The maximum weight for this metric is 10 points.
“Millennial population growth” tracks the change in each city’s Millennial population based on U.S. Census Bureau data from 2013 through 2017. Values scored represent the change in the millennial population over a total of five years. The maximum weight for this metric is five points.