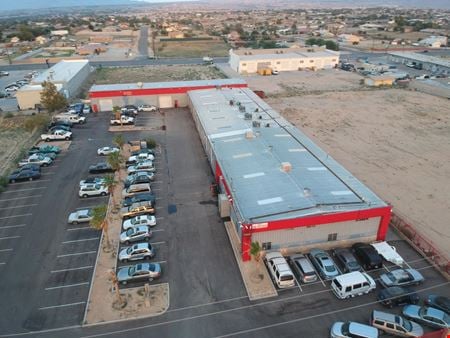
Hesperia, CA Commercial Real Estate for Lease and Sale
Explore 53 listings of Hesperia commercial real estate to find the best space for your business.
-
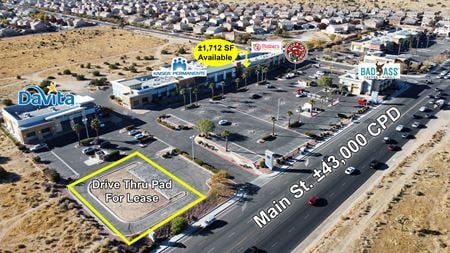 14101-14177 Main St, Hesperia, CAProperty
- Retail
- 7,721 SF
Availability- 2 Spaces
- 7,712 SF
Year Built- 2000
For Lease Contact for pricing -
-
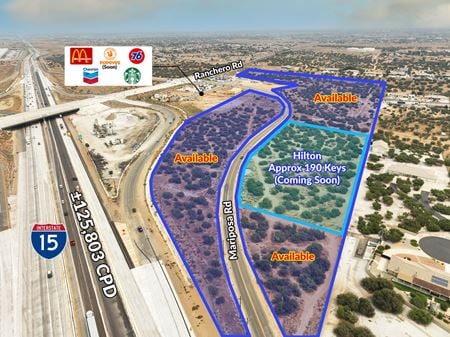
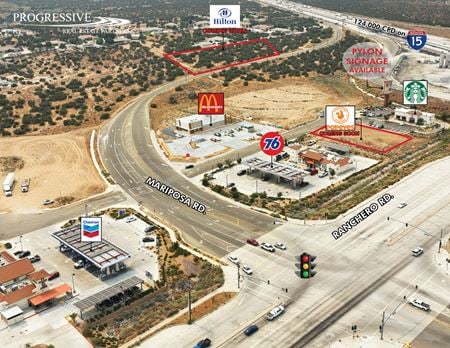 Ranchero Rd & 15 Freeway, Oak Hills, Hesperia, CAProperty
- VacantLand
For Sale- Subject To Offer
-
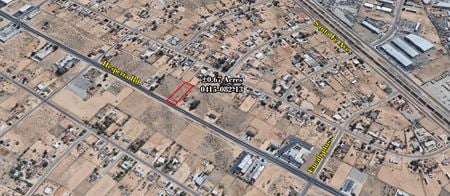 ±0.67 Acres Commercial Land, Hesperia, CAProperty
- VacantLand
For Sale- $120,000
-

What type of listing property are you looking for?
-
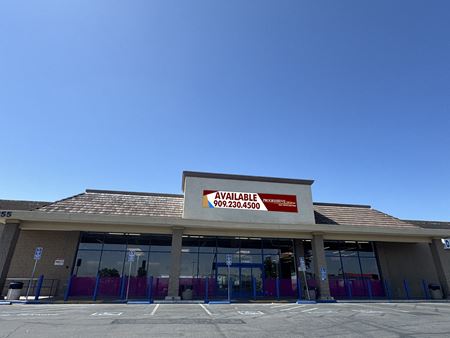
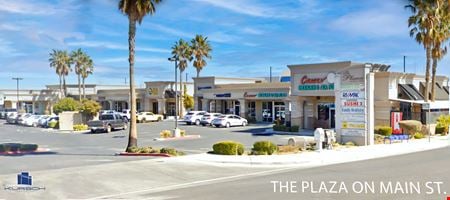 15550 Main St, Hesperia, CAProperty
- Retail
- 23,058 SF
Availability- 2 Spaces
- 3,364 SF
Year Built- 2006
For Lease- $1.50 - $18.00/SF/YR
-
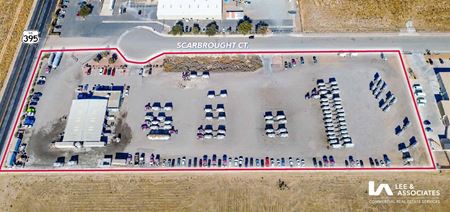 12135 Scarbrough Court, Hesperia, CAProperty
- Office
- 10,125 SF
Availability- 1 Space
- 277,620 SF
For Lease- $0.20/SF/YR
-
11129 G Ave, Hesperia, CAProperty
- Industrial
- 17,100 SF
Year Built- 1980
For Sale- $1,650,000
-
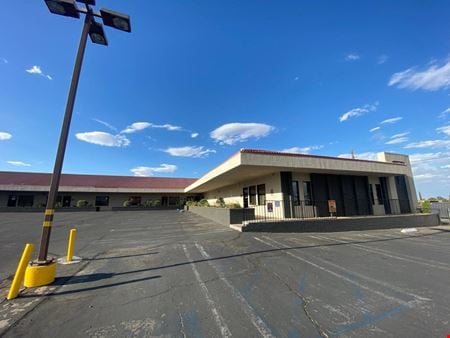 17450 Main St, Hesperia, CAProperty
- Office
- 15,516 SF
Availability- 2 Spaces
- 2,712 SF
Year Built- 1986
For Lease- $18.24 - $20.40/SF/YR
-
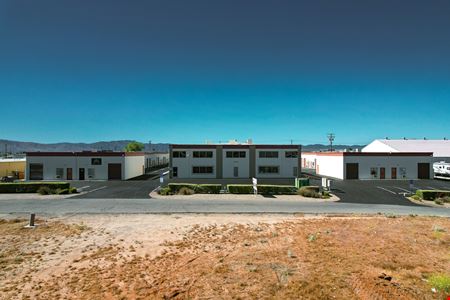 17525 Alder St., Hesperia, CAProperty
- Industrial
- 52,656 SF
Availability- 9 Spaces
- 12,192 SF
Year Built- 1989
For Lease- $1.00 - $1.05/SF/MO
-
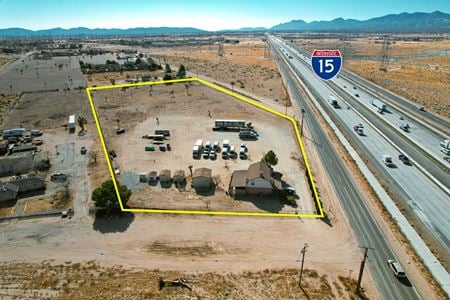
-
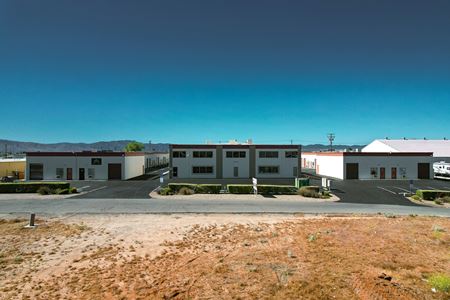 17525 Alder St, Hesperia, CAProperty
- Industrial
- 52,656 SF
Availability- 1 Space
- 960 SF
Year Built- 1989
For Lease- $1.05/SF/MO
-
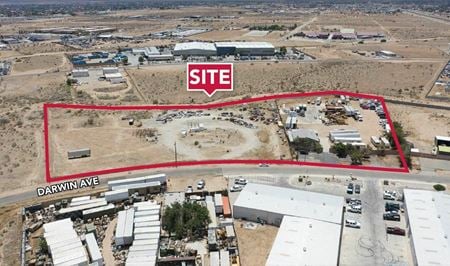 17011 Darwin Ave, Hesperia, CAProperty
- VacantLand
- 1,840 SF
Availability- 1 Space
- 267,023 SF
Year Built- 1985
For Lease- $0.08/SF/MO
-
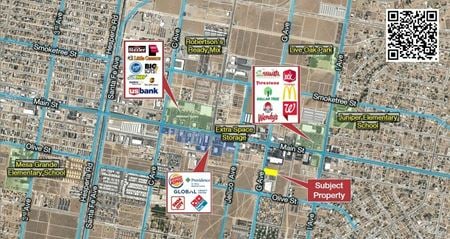
-
 17255 Main Street, Hesperia, CAProperty
- Retail
- 52,511 SF
Availability- 3 Spaces
- 36,200 SF
For Lease- $1.15 - $1.75/SF/MO
-
 17011 Darwin Ave, Hesperia, CAProperty
- VacantLand
- 1,840 SF
Year Built- 1985
For Sale- $3,105,828
-
-
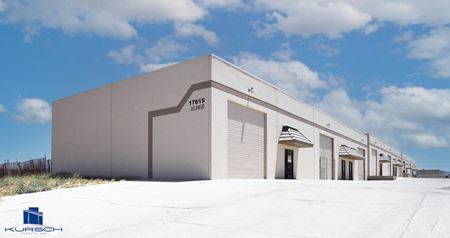 17615 Alder Street, Hesperia, CAProperty
- Industrial
- 35,880 SF
Availability- 3 Spaces
- 6,000 SF
Year Built- 1987
For Lease- $1.25/SF/MO
-
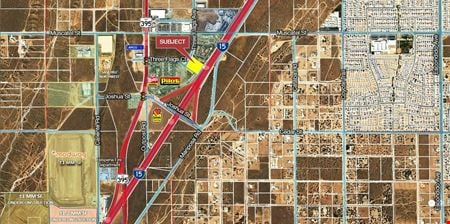 Three Flags Ave, Hesperia, CA
 -
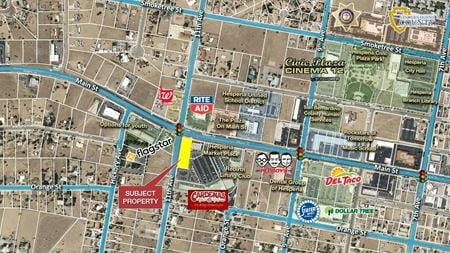
-
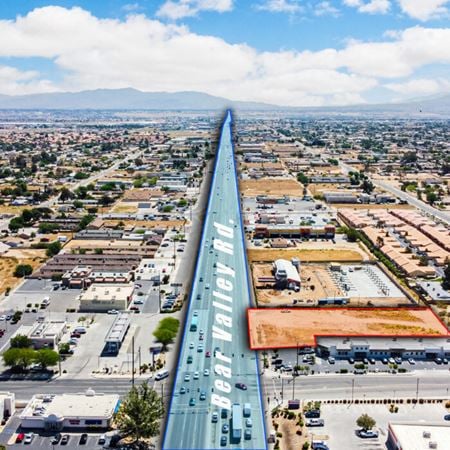 15335 Bear Valley Rd, Hesperia, CA
 -
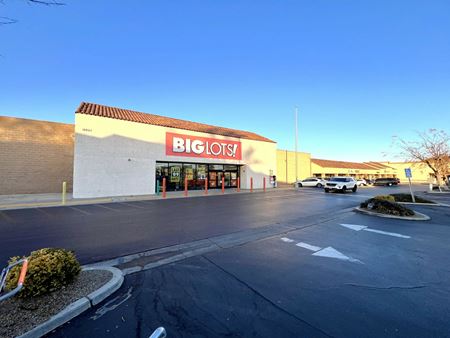 16824 MAIN ST, Hesperia, CAProperty
- Retail
- 33,440 SF
Availability- 1 Space
- 33,400 SF
Year Built- 1989
For Lease Contact for pricing -
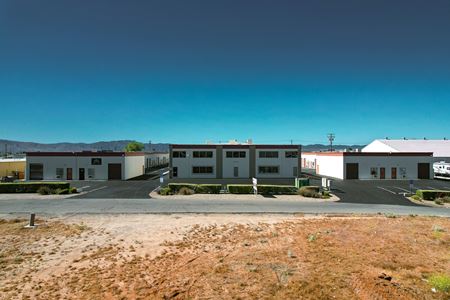 17525 Alder St. #7, Hesperia, CAProperty
- Industrial
- 52,656 SF
Availability- 1 Space
- 960 SF
Year Built- 1989
For Lease- $1.05/SF/MO
-
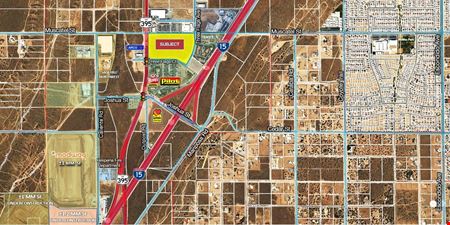 8685 US Highway 395, Hesperia, CA
 -
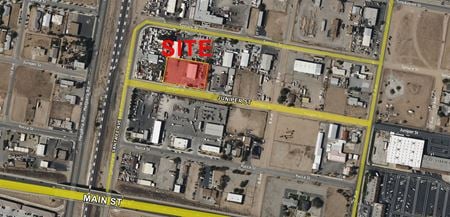 16660 Juniper St, Hesperia, CAProperty
- Industrial
- 4,571 SF
Availability Contact for availabilityYear Built- 2007
For Lease Contact for pricing -
-

-
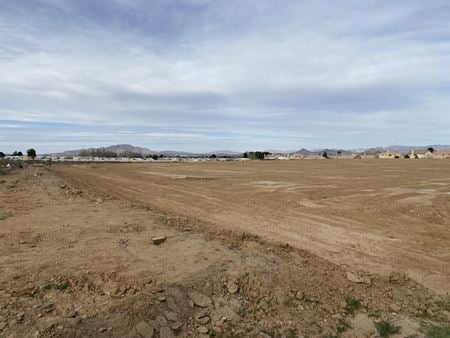
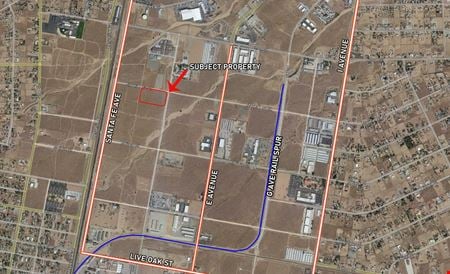 C Avenue and Mauna Loa Street (APN 0410-041-37), Hesperia, CAProperty
- VacantLand
For Sale- $450,000
-
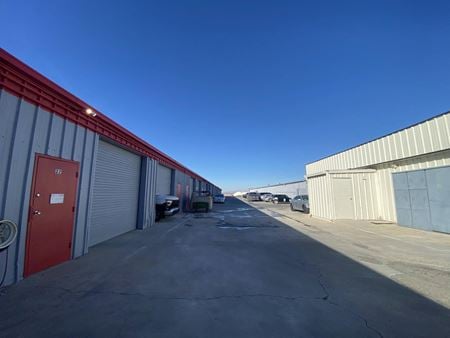 17415 Catalpa Street, Hesperia, CAProperty
- Industrial
- 30,044 SF
Year Built- 1987
For Sale- $3,350,000
-
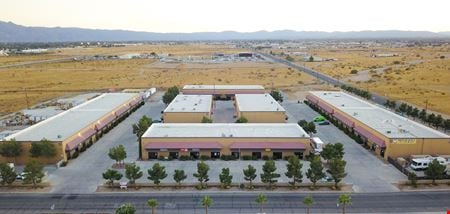 17229 Lemon St., Hesperia, CAProperty
- Industrial
- 102,120 SF
Availability- 3 Spaces
- 9,600 SF
Year Built- 1986
For Lease- $1.10/SF/MO
-

-

-
 NWC Main St & Cataba St, Hesperia, CA
 -
 Bear Valley Rd. & Mesa Linda, Victorville, CAProperty
- VacantLand
- 446,490 SF
For Sale- $2,850,000
-

-

-
 12684 Main St, Hesperia, CAProperty
- Retail
- 35,005 SF
Availability- 1 Space
- 35,005 SF
For Lease- $120,000.00/YR
-
 SWC Bear Valley Rd & Hwy 395, Victorville, CA
 -
 SEC Bear Valley Rd & I Ave, Hesperia, CA
 -
 NWC Bear Valley Road & Hesperia Road, Victorville, CA
 -
 Main St & 15 Fwy (SEQ), Hesperia, CAProperty
- VacantLand
- 4,155,188 SF
For Sale- Call For Info
-

-

-
 SEC Bear Valley Rd & I Ave, Hesperia, CA
 -
 APN: 0357611170000, Hesperia, CAProperty
- VacantLand
- 43,595 SF
For Sale- $749,000
-
 NWC Poplar Street & Mesa Linda Street, Hesperia, CA
 -
 US-395 & Three Flags Ct, Hesperia, CA
 -
 SEC Bear Valley Rd & I Ave, Hesperia, CA
 -
 14449 Main St, Hesperia, CA
 -
 Bear Valley Rd. , Hesperia, CA
 -
 17525 Alder St. # 6, Hesperia, CAProperty
- Industrial
- 52,656 SF
Availability- 1 Space
- 960 SF
Year Built- 1989
For Lease- $1.05/SF/MO
-
 9280 Maple Ave, Hesperia, CA
 -
 SEQ Mariposa Rd. & Bear Valley Rd. , Hesperia, CA
