Office Activity in Manhattan Loses Momentum, Ends Q2 with $2.9B in Sales Volume


Executive Summary
- office sales volume drops 25% y-o-y, closes Q2 at $2.9B
- the average price per square foot dips 16% y-o-y to $867
- 5 Bryant Park trades for $640M in largest Q2 sale
- 3 WTC comes online in Q2, 4.7 MSF left in the 2018 pipeline
Over the past two years, office sales activity in Manhattan has slowed to a more sustainable level, finally coming down from the highs of 2014 and 2015. In Q2 2016, the total sales volume reached close to $9 billion, then it dropped to $3.8 billion in Q2 2017 and to $2.9 billion in Q2 2018. Manhattan office sales started 2018 in full force, reaching a five-year high in terms of the average price per square foot–$1,266. The highlight of the first quarter was Google’s acquisition of Chelsea Market for a whopping $2.4 billion, a sale which accounted for more than half of the total quarterly sales volume.
The year’s second quarter ended with $2.9 billion in office sales volume, 25% below the level of the previous year, and an average sale price of $867 per square foot, per Yardi Matrix data. However, the significant drop in sales activity is no cause for concern and does not reflect decreased investor interest in Manhattan office space. There simply were no high-profile, billion-dollar office deals to close during the past three months–the largest transaction of Q2 was the $640 million sale of 5 Bryant Park to Savanna. Read on to see how the market fared during the second quarter of 2018, and scroll down for the full methodology.
Manhattan Office Sales Drop 25% Y-o-Y in Q2
Following a strong first quarter, which recorded $4.5 billion in sales volume and a 126% year-over-year growth, the second quarter of 2018 marked a cool-down for the Manhattan office market. The total sales volume slipped 25% year-over-year and 37% compared to Q1, resting at $2.9 billion at the end of June (see ‘Methodology’). Ten office properties totaling 4.6 million square feet of space changed hands during Q2 2018, compared to 9 deals and 3.6 million square feet of space traded in Q1.
The low sales activity during Q2 comes as a disappointment following two consecutive quarters with more than $4.5 billion in office transaction volume, namely Q4 2017 and Q1 2018. What brought the sales volume down in Q2 was the absence of the high-profile, billion-dollar office deals we’ve become accustomed to in this thriving market–the largest sale of Q1 accounted for more than half of the total quarterly sales volume. By comparison, the largest office transaction of Q2 2018 was the sale of 5 Bryant Park for $640 million.
Average Prices Slip 16% Y-o-Y to $867 per Square Foot
Having reached a five-year high in terms of the average price per square foot in Q1, the Manhattan office market saw prices come back down in Q2. The average price for office buildings trading in Manhattan closed the year’s second quarter at $867 per square foot, marking a 16% drop year-over-year. The Q2 2018 value also marked a 32% decrease compared to Q1, when assets changed hands for an average price of $1,266 per square foot.
Savanna Grabs 5 Bryant Park for $640M in Largest Q2 Deal
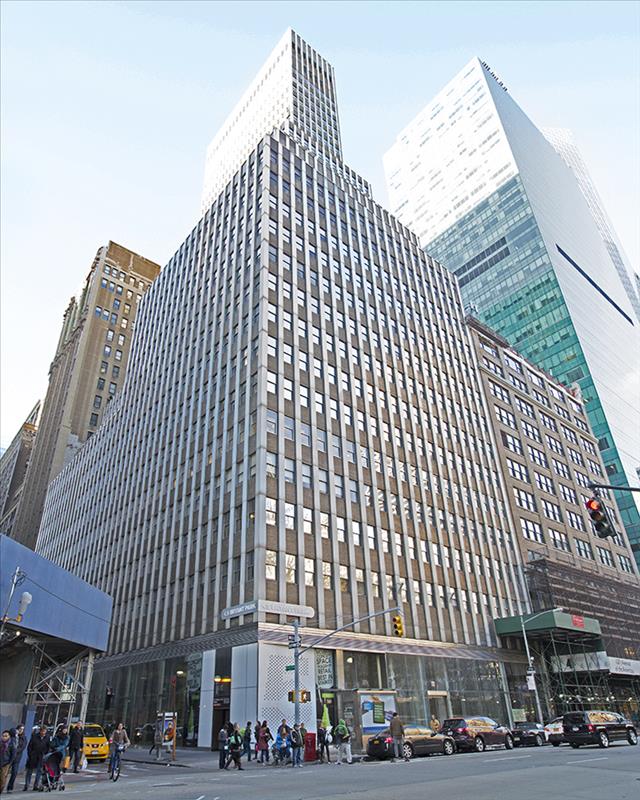
5 Bryant Park, Manhattan (Yardi Matrix)
A total of 10 major office transactions closed during Q2 2018 for $2.9 billion, marking a 37% decrease compared to the previous quarter. However, the first quarter of 2018 benefited from the $2.4 billion sale of Chelsea Market, which accounted for more than half of the total quarterly transaction volume.
The largest transaction of Q2 was Savanna’s $640 million purchase of 5 Bryant Park from Blackstone, in May. Savanna paid $939 per square foot for the 34-story, 681,790-square-foot high-rise previously known as 1065 Avenue of the Americas. The deal was aided by a $463 million loan provided by Deutsche Bank, according to Yardi Matrix data. The asset had been acquired by Blackstone and Brookfield Properties in 2006, as part of an $8.9 billion portfolio transaction closed with Trizec Properties. The joint venture purchased 63 office assets from Trizec, totaling 27 million square feet of office and retail space spread across 10 major U.S. markets.
Other notable Q2 transactions included Invesco’s $596 million acquisition of 1745 Broadway from SL Green, and STRS Ohio’s $432 million purchase of 10 Hudson Yards from Related Cos. and Oxford Properties Group. A foreign buyer also managed to squeeze into the top 5 office deals list: Frankfurt-based Commerzbank paid $333 million to acquire the property at 222 E. 41st St. from Columbia Property Trust in June.
3 WTC Comes Online in Q2; 4.7 MSF of Office Space Left in the 2018 Pipeline
Only one major office project was delivered to the Manhattan market in Q2, namely the 2.8 million-square-foot 3 World Trade Center. The 80-story high-rise located at 175 Greenwich St. is owned by Silverstein Properties and is subject to an 86-year unsubordinated net ground lease held by the Port Authority of New York and New Jersey, expiring in 2100. The Class A+ tower shares 350,000 square feet of underground retail space with the World Trade Center Transportation Hub, and aims to achieve LEED Gold certification from the USGBC. The building’s tenant roster already includes high-profile names, such as McKinsey Group, Hawksmoor and GroupM, with 1.5 million square feet of office space still available for lease, per Yardi Matrix data.
The pipeline for the remainder of 2018 consists of 13 projects totaling 4.7 million square feet of office space. The largest office development currently in the pipeline is the 1.4 million-square-foot 55 Hudson Yards, owned by Mitsui Fudosan America. The 51-story high-rise located in the Chelsea submarket is subject to a 30-year PILOT ground lease held by the New York City Industrial Development Agency, expiring in 2044, and is scheduled for completion in August 2018.
By Ioana Neamt
Methodology
We used detailed Yardi Matrix data to analyze all office transactions with price tags equal to or exceeding $5 million to close in Manhattan during the second quarter of 2018 (April through June). Our analysis, based on data recorded up until July 2nd, 2018, includes completed office buildings equal to or larger than 50,000 square feet that changed owners during the quarter. In the case of mixed-use assets, only properties featuring over 50% office space were taken into account. We counted portfolio deals as single transactions and excluded distressed sales altogether.
To make sure the trends and comparisons presented in our analysis are valid, we excluded portfolio, partial interest and ground lease deals from our calculation of the average price per square foot.
While every effort was made to ensure the timeliness and accuracy of the information presented in this report, the information is provided “as is” and neither CommercialCafe nor Yardi Matrix can guarantee that the information provided is complete.
Property images courtesy of Yardi Matrix.


Contributor
Our contributor content includes articles written by guest authors who are professionals in a variety of relevant fields and have contributed their expertise and detailed understanding of a range of topics, including: PropTech; real estate marketing tools and strategies, commercial real estate trends evolution; work-life balance management guidance and resources; workspace management and design; and more.