Innovation in the USA: Mapping 4 Decades of Patent Activity


This year’s challenges have been yet another reminder of the importance of invention and adaptability in all aspects of our lives, and that innovation is key to persisting and thriving through the ever-surprising hurdles encountered by humans in the modern age. In celebration and support of the culture of innovation that has long been synonymous with the United States, we looked at more than four decades of national patenting activity. Specifically, we explored the wide-reaching economic importance of U.S. innovation and the essential relationship between the corporate patenting model and small business invention. We also tracked the U.S. corporations that have been leading the race for intellectual property. The accompanying maps, charts, and graphs in this article offer a nationwide perspective of invention by looking at the distribution of patents and patent applicability across industries and state lines. Visit the methodology section for more details.
Data Highlights Summary
- About 51% of patents granted in the U.S. between 1975 and 2019 have U.S.-based assignees, amounting to 3,331,802 claimed inventions.
- Patent activity peaked most recently in 2013, when 144,072 patents were granted — the most in a single year.
- The highest patent applicability to date falls under physics (1.1 million patents). Within this field, innovation in computing and information storage has contributed significantly to increases in patent activity in recent years.
- The five most innovative U.S. corporations to date are IBM, General Electric, Intel, Hewlett Packard and Microsoft.
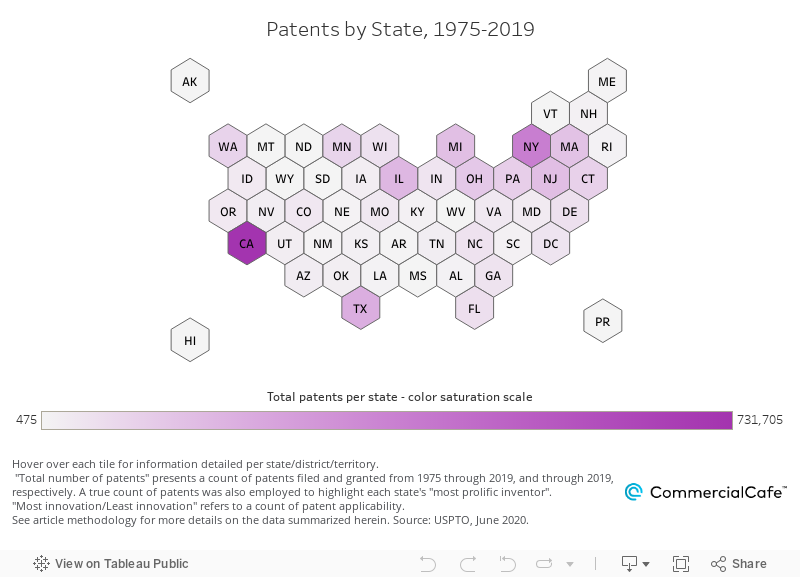
- The five most innovative states to date are California, New York, Texas, Illinois and New Jersey. In particular, a total of 731,705 U.S.-based assignee patents were filed and granted in California between 1975 and 2019, which puts the Golden State in the lead for patenting activity. The interactive map below provides data on patent totals and select innovation highlights for each state:
Innovation Nurtures Economic Expansion
Growth in the U.S. economy is driven by dynamism — which, in turn, is fueled by innovation. Historically, small U.S. businesses and widespread entrepreneurship have driven American innovation. And, over time, the infrastructure of U.S. innovation itself has undergone several stages of progress and adaptation. For instance, during the “Golden Age” of invention — between the late 1800s and mid-1900s when the U.S. led the world’s industrial revolution — innovative activity happened largely outside of the corporate frame. At that time, world-changing ideas were given physical form by individual creators with financial backing from various investors. As the Harvard Business Review (HBR) noted in a comprehensive 2017 study, the modern corporation research and development model had outweighed individual inventor patents by the middle of the 20th century. Then, by the year 2000, corporate assignees accounted for 80% of patents.
Furthermore, the same analysis found that innovation — regardless of the originator — had a positive influence on economic growth. It also noted a strong positive correlation between patenting activity and gross domestic product per capita at the state level. In any case, securing economic growth depends on investing in dreams of progress. As such, it’s reasonable to assume that the best way to invest in the dream is to support the dreamers. But, because humanity has yet to invent a way to predict ideas and inventors, the safest bet on securing long-term growth is to invest in education and innovation across the board.
Meanwhile, nationwide patent applicability distribution shows how innovation in different fields has progressed and concentrated differently along corridors and in regions. Mapping out this data (below) shows that California leads the nation as the most fertile ground for invention. Socially and economically open to disruptive new concepts, home to vast populated areas with strong capital markets that could finance invention, California also offers innovators access to well-connected markets and stands out with the highest patent applicability for six of the nine main patent classification sections: human necessities; performing operations and transporting; chemistry and metallurgy; physics; electricity; emerging cross-sectional technologies.
On the opposite coast, New York takes first place for count of patent applicability in textiles and paper, while the highest count of patent applicability for innovation in fixed construction is in Texas. Michigan leads the way in patents applicable in the CPC section that includes mechanical engineering, lighting, and heating.
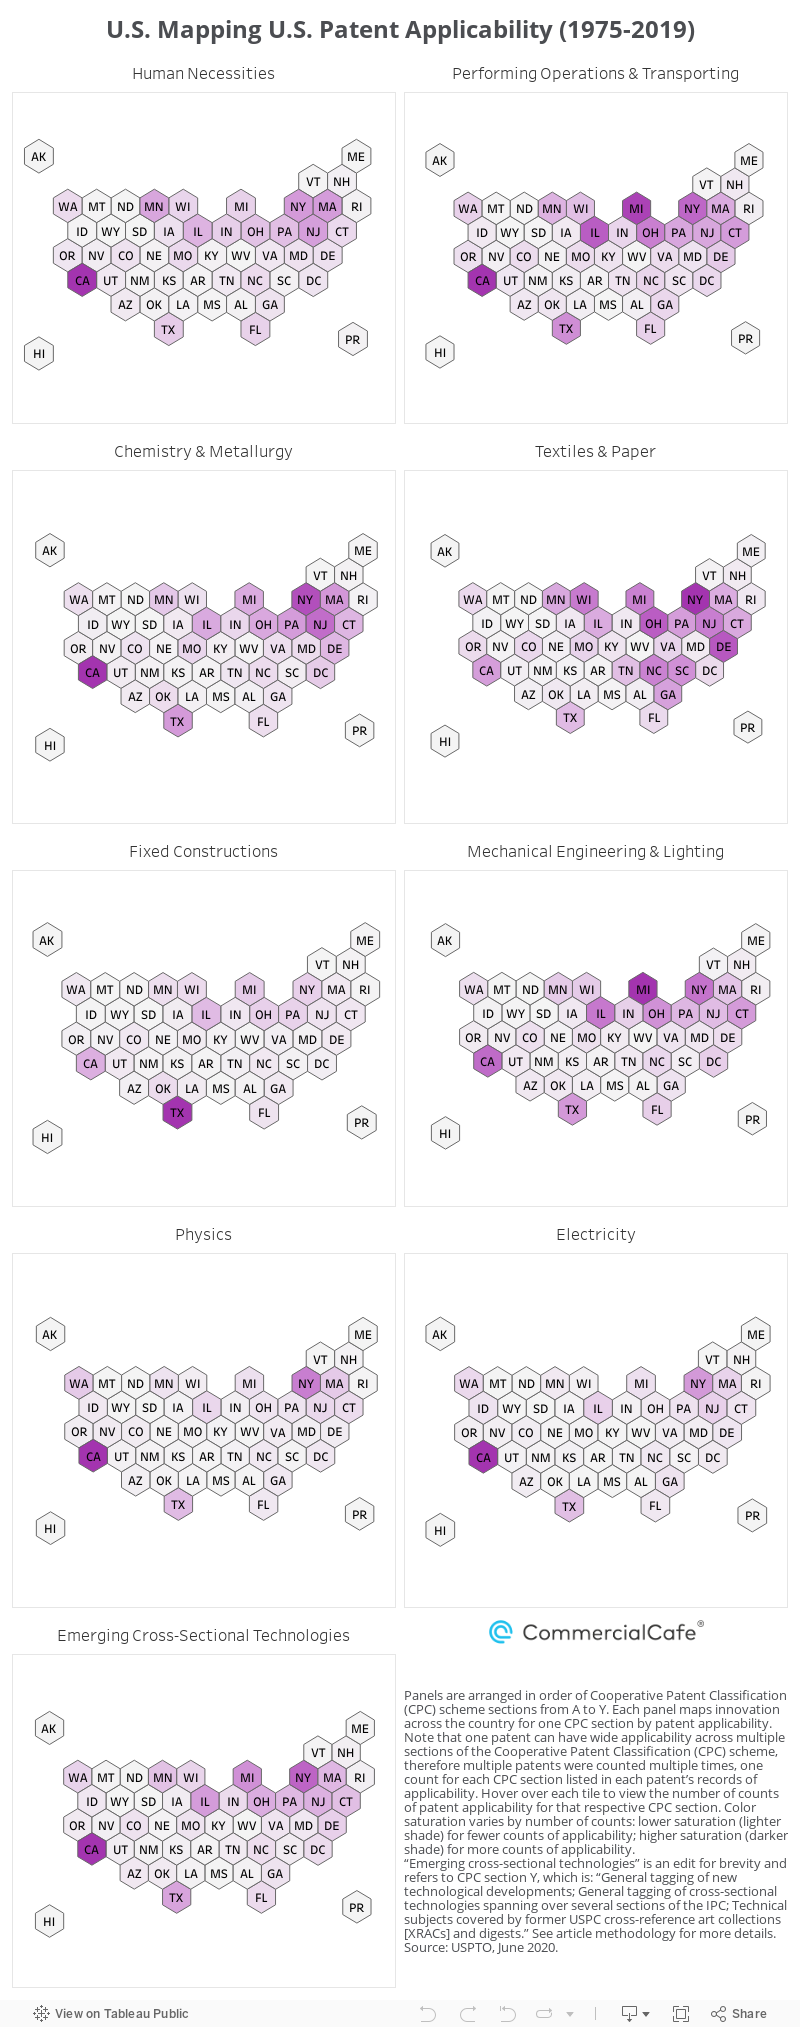
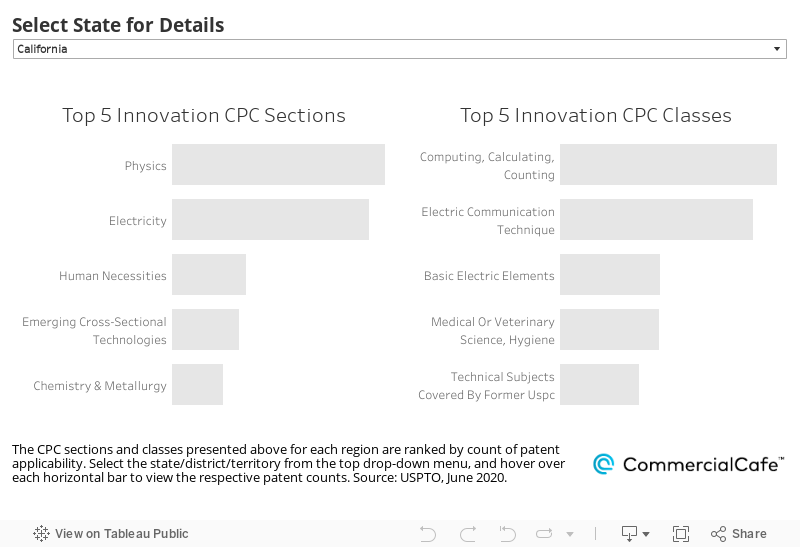
Use the interactive graph below to see more details on fields of innovation in each state, as well as in Puerto Rico and Washington, D.C.:
Emerging Technologies Catching Up to Innovation in Physics & Electricity
Because humans invented money, it costs money for humans to live on Earth. And, it costs even more money for humans to constructively transform the quality of our collective lives. But, while the immediate desired effect of investing in new ideas is economic gain, one should not let obvious monetization cloud their judgment regarding concepts that may not reveal their most profitable applicability right away. For example, one patented invention can often be applied across multiple industries beyond its primary intended use. USPTO data for the past 45 years shows that most patent applicability in the U.S. fell to physics, with electricity a relatively close second. Research in these two general fields yielded almost all of the conveniences — as well as the technological achievements — that we’ve enjoyed and celebrated in our lifetimes.
Patents with applicability in emerging cross-sectional technologies currently rank third. This vast area of research and development marks the most modern age of innovation, which seeks to successfully navigate some of the wider-reaching challenges that lie ahead.
To that end, in his book, “How We Got to Now: Six Innovations That Made the Modern World,” author Steven Johnson pursues the unpredictable course of human invention and makes an excellent demonstration of the term “adjacent possible” (originally coined by complexity theorist Stuart Kauffman). Specifically, Johnson explains that each new idea, technology, platform or other innovation inspires whole new sets of possibilities that were previously unimaginable. That’s why it’s essential to continue fueling innovation in order to maintain growth in diversity — which, in turn, sustains constructive competition and economic growth.
Over time, countless anecdotes of inventions demonstrate that innovation is a non-linear chain reaction, and that modern life as we know it is mostly the result of unintended consequences — a multitude of situations in which one idea sparked countless others in various fields. For example, while he was conducting research on hypothermia and trying to generate heat through radio frequency to restore body temperature, electrical engineer John Hopps’ work led to the invention of the pacemaker in the early 1950s. As a result, according to the American Heart Association, by the early 2000s, there were nearly 3 million pacemakers in operation worldwide, with 600,000 new pacemakers implanted each year.
Likewise, in the mid-1800s, chemist William Henry Perkin was experimenting with ways to synthesize anti-malarial drug quinine. In the process, he accidentally created mauveine — one of the world’s most elusive dyes at the time, a highly coveted stable purple. Furthermore, Perkin’s subsequent work with dyes inspired the lifelong research conducted by bacteriologist Paul Ehrlich, whose Nobel Prize-winning work in immunology formed the basis for chemotherapy.
Similarly, Patsy Sherman, a chemist employed by 3M, was researching rubber material that wouldn’t deteriorate from exposure to jet aircraft fuels. During this process, she identified a stain-resistant compound that is widely known today as Scotchgard. And, when Raytheon Corporation engineer Percy Spencer was conducting experimental research related to radar technology, he realized how microwaves can be used to thermally process foods. Following a series of successful simple experiments, Raytheon filed for a patent in October 1945, and the Radarange microwave oven was on the market in 1946.
The Race for Intellectual Property – U.S. Corporations Lead Patent Activity
Patent regulations state that the patent owner has the right to exclude non-owners from making, using, offering for sale, selling or importing the invention claimed in the patent. However, such guardianship often requires significant financial resources and, in most cases, ownership is assigned by the inventor to a separate party. Corporations are more likely to have the financial resources needed to shoulder such an investment, as well as the costs of R&D, manufacturing and subsequent commercialization. Accordingly, of the 3.4 million patents considered in this study, 98.8% are assigned to corporations. Clearly, corporations have competed intensely for patent ownership — whether to support science, research and innovation; protect inventions from unfair imitation; or for other strategic reasons. Therefore, we looked at which corporate entities — both private and public — have occupied the top 10 spots for total patents owned (assigned) between 1975 and 2019. Check them out in the interactive bar chart below:
In 1975, IBM was the assignee on 485 patents filed — just one behind Westinghouse Electric. Westinghouse, in turn, was third behind Xerox and GE at the time. However, in just 10 years, IBM took the lead from GE and has yet to be dethroned. What’s more, IBM inventors were awarded 9,262 patents in 2019 — the most patents received by a company in a single year — which also marked IBM’s 27th consecutive annual lead. In fact, the company has accrued ownership of more than 140,000 patents that span everything computer science, from John Royden Peirce’s punched card system for tabulation to quantum computing and artificial intelligence.
Dominant U.S. electronics and communications firm, RCA Corporation, was among the top 10 most innovative corporate entities in the U.S. until 1991. The iconic American company pioneered both radio and television, but its success permeated more than just broadcasting. For instance, RCA’s commitment to anchoring the first development phase of Rockefeller Center played a major role in the region’s economic recovery during the 1930s. In particular, work on the Midtown landmark accounted for more than 70,000 jobs in New York alone at the height of the Great Depression, and the total exceeded 200,000 when you include suppliers and manufacturers across the country. To this day, the RCA Building remains the focal point of the complex, incorporating some of the most coveted office space in New York City, as well as iconic entertainment space and an observation deck from which New Yorkers could witness the Hindenburg’s arrival from Germany in May 1936.
Office spaces in the U.S. have long been at the forefront of innovation. Check out some of the most forward-thinking office markets in the U.S. and the robust office space offers they present:
Meanwhile, George Westinghouse built a legacy of 60 companies and more than 300 patents by the end of his life. And, the significant contributions of these companies extended beyond revolutionizing transportation and power both through and beyond the eve of the industrial age. Notably, Westinghouse was among the first adopters of the concept of corporate intellectual property itself, and the patent department organized at Westinghouse Electric in 1888 was among the earliest to recognize the value and potential of a “knowledge economy.”
The corporate research and development model has also proven valuable in terms of access to resources and distribution. Specifically, corporate investment in innovation has facilitated the invention of a large number and variety of technologies that sustained rapid growth of the national economy. However, it might be the case that, by virtue of recruiting personnel and supporting research that align mostly or exclusively with the corporation’s own direction, this model inadvertently limits the breadth of the “adjacent possible.” That’s because other ideas and the new companies to which they can give rise also need room and resources to grow. As such, small businesses are essential to maintaining a competitive economy. In fact, the 2020 Profile compiled by the U.S. Small Business Administration reported that, in 2019, there were 31.7 million U.S. small businesses that employed 47.1% of the private workforce.
Furthermore, the patent data we analyzed showed that only 1.2% of U.S. patents filed and granted between 1975 and 2019 had individual (non-corporate) U.S.-based assignees. Undoubtedly, at a time when the technologies that surround and support us are rapidly transforming, celebrating science by supporting innovation across the board is key. Plus, increased funding for research, as well as welcoming and nurturing multicultural talent, are essential investments in American innovation for the U.S. economy to recover, as well as remain competitive and inspirational on the world stage.
Methodology
Existing literature on technological change has established patents as a highly relevant measure of innovation. We based this article on data we obtained from the U.S. Patents and Trademark Office in June 2020. Our analysis focused on patents for which the assignees are based in the United States. The patent year represents the application date for patents that were also granted/approved. Consequently, for years 2018 and 2019, there are fewer entries counted because not all applications filed during that time period had been granted patents yet. As a result, our data set includes U.S.-based assignee patents granted for which applications were submitted from 1975 through 2019 across the contiguous continental United States, as well as in Alaska, Hawaii and Puerto Rico.
The assignee listed on a patent is the entity, which is either a person or a company that has the property right to the patent. This may or may not coincide with the person or entity listed as the inventor. For the purposes of this article, we opted to filter patent data by assignee. The pie chart below shows the distribution of this criterion across the initial data set. Despite our best intentions to also highlight individual inventors, this information was not available for Puerto Rico or Washington, D.C.
For all perspectives presented regarding fields of interest and industries of innovation, we referred to the Cooperative Patent Classification system, which breaks down patent applicability into sections and sections into classes. Additionally, one patent may apply to one or more sections, as well as one or more classes. In order to best represent innovation by CPC section, we considered not individual patents, but rather counts of patent applicability. Therefore, when reading that 1.1 million patents applied to physics, note that it means there were 1.1 million counts of applicability of the patents considered. The number of individual patents may differ from that.
*Emerging cross-sectional technologies is an edit for brevity and refers to CPC section Y, which is: “General tagging of new technological developments; general tagging of cross-sectional technologies spanning over several sections of the IPC; technical subjects covered by former USPC cross-reference art collections [XRACs] and digests.”
Additional proprietary research was conducted for the body of the article. The dynamic bar chart tracking most innovative U.S. corporations was made using Flourish.
The Coworking Space Industry Grows at the Forefront of Modern U.S. Innovation
Modern technology supports innovative collaboration more significantly than ever before. Across the country, the desire to connect with like-minded entrepreneurs, inventors, learners, and mentors has inspired the rise of some of the most creative startup hubs in the world. In particular, coworking and shared workspaces today nurture some of the most driven environments for growth-oriented networking, which feed innovation across all industries, both modern and traditional. Explore available options at the locations linked below, or go to the CommercialCafe homepage and research other markets for the best coworking space listings for you.


Ioana Ginsac
Senior Content Writer, Industry News & Reports
Ioana is a content writer who has been covering all-things-CRE (and more) for several Yardi network publications since 2017. You will find her byline regularly in industry news and market reports, but also on articles covering sustainable development, green urbanism, and innovation, all of which she has been passionately learning about for more than a decade. Her work has been referenced by publications including AmericanInno, Bisnow, BusinessInsider, Commercial Property Executive, Curbed, Fast Company, Forbes, GlobeSt.