Study: What to Do with All the Vacant Land in Major US CBDs?


Ultimately, a city’s fate depends on the type of vacant land it has at its disposal, the strength of the local economy, and the policies the city enacts. A comprehensive inventory study helps to advance both research and practice in urban land policy.
(G.D. Newman et al., A current inventory of vacant urban land in America, Journal of Urban Design, 2016)
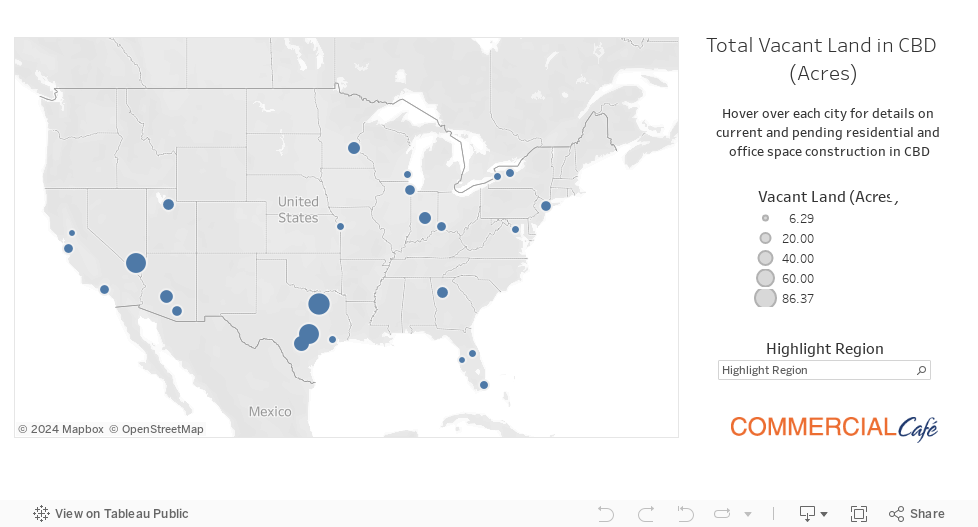
- 584 acres of undeveloped land lies vacant in the country’s 25 largest urban cores, the equivalent of 442 football fields. Major S-SW metros like Dallas and Las Vegas are home to the most undeveloped land, while eastern urban sprawls like Tampa are the densest;
- Urban construction in recent years has failed to address the needs of the citizens, according to our nationwide survey; 82% of respondents say their city needs more homeless shelters and affordable housing
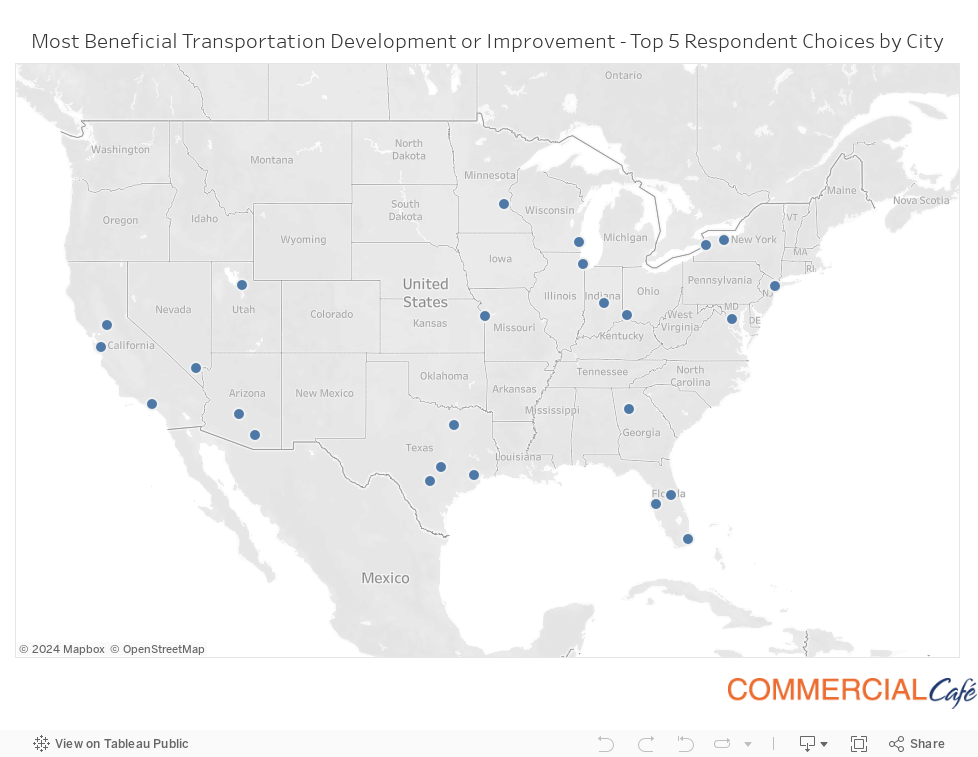
- Sustainable urban transport is gaining ground—improved walkability, car pool lanes, and infrastructure upgrades were our respondents’ top choices
CommercialCafe proposes an urban development study that combines a new inventory focused on vacant parcels located in central business districts, with in-depth research on CBD construction activity, as well as a 25-city survey that gauges what developments are most desirable to the local urban population. Our research shows that recent development efforts have failed to address the needs and wants of the citizens living and working in these 25 cities. The lack of affordable housing options continues to drive working Americans out of the cities, and even out of a home; however, new residential construction is too little and too high-end to fill the demand gap. Urban sprawl has become a notable strain on residents, infrastructure, and local budgets, and is far behind the sustainable, compact, walkable communities that today’s Americans aspire to. Read on to see what our study uncovered and how we conducted our research.
The Purpose of This Study
The state of the union’s economy rests in the heart of its cities—the nation’s hubs are always hard at work churning out value, some faster than others. According to the BEA (as presented by Forbes), the economies of U.S. cities grew 11% between 2011 and 2016, on average. A recent study conducted by Headlight Data found that the highest growth in the gross regional product (GRP) of large metros was seen in San Jose, Austin, and San Antonio, while metros with the slowest growth included Tucson, Rochester and Milwaukee. But what does growth mean for cities? It means an increase in population, more jobs, making room to accommodate an economic expansion, or even redrawing city boundaries. Eventually, it means banking on salvageable abandoned structures and developable vacant lots, and this is where market research usually comes to a screeching halt. How much land is vacant? Is it developable? Which zoning laws apply? What developments would the surrounding communities support? These are only a few of the issues in which such studies get tangled.
Previously conducted nationwide research efforts captured isolated snapshots of U.S. urban landscapes, decades apart. On average, 21% of land was vacant in 48 major cities in the first half of the 1960s (Niedercorn, John H., “Recent Land-use Trends in Forty-Eight Large American Cities,” 1963). This estimate grew to an average of 25% per city, in an 86-city analysis conducted just 10 years later (Northam, Ray M., “Vacant Urban Land in the American City,” 1971). The massive waves of deindustrialization, urbanization and high-density urban construction that swept the nation during the following three decades led to a 10% reduction of the national average of urban vacant lands and abandoned structures, as urban cores densified and in-migration intensified.
Studies conducted in the early 2000s estimated that the average amount of vacant land per city had increased to 15%, encompassing what seem to be the leftovers of progress—scraps of land that are too small, too oddly shaped, unusable because of some physical limitations, or problematic in other ways.
We set out to get some answers and carry on the conversation about the gaps in America’s urban cores—while these previous studies were all conducted on a city-wide scale and all factored in abandoned structures as being inextricably linked with vacant lots, the inventory we propose is focused only on vacant parcels located in central business districts.
Methodology
We combed Yardi Matrix and PropertyShark data, as well as online government records to determine the amount of land that currently remains undeveloped in the urban cores (CBDs) of 25 American cities: Atlanta, Ga.; Austin, Texas; Buffalo, N.Y.; Chicago, Ill.; Cincinnati, Ohio; Dallas, Texas; Houston, Texas; Indianapolis, Ind.; Kansas City, Mo.; Las Vegas, Nev.; Los Angeles, Calif.; Miami, Fla.; Milwaukee, Wis.; Minneapolis, Minn.; New York, N.Y.; Orlando, Fla.; Phoenix, Ariz.; Rochester, N.Y.; Sacramento, Calif.; Salt Lake City, Utah; San Antonio, Texas; San Jose, Calif.; Tampa, Fla.; Tucson, Ariz.; Washington D.C.
Only the neighborhoods designated as pertaining to the CBD area were selected for each city. Where location by neighborhood was not possible, selection was made based on CBD zoning codes. Of the parcels of land located in these select areas, our research focused on undeveloped property. As demonstrated by previous studies, the definition of “vacant land” is broad and inconsistent. In the interest of this study, we included lots that are mainly designated as “vacant lots-no improvements,” and carry a sub-designation matching “vacant commercial” or “other vacant.” The selection of undeveloped parcels was further filtered by size—we considered a minimum lot size of 0.5 acres. Each parcel was thoroughly double-checked against Official Assessor records and GIS County pages to ensure, to the best of our ability, that no surface parking areas or otherwise improved vacant lots were included in the total reference area for each city.
Information on recent construction was compiled with the help of PropertyShark data, and is expressed as of February 2018, going back to the start of 2013. The location of construction completed since the start of 2013 was selected using the same zipcode, neighborhood and zoning criteria as were applied for the vacant lots inventory location selection. This data set sums up all the parcels with buildings of at least 15,000 square feet. Recent construction data for Atlanta, Buffalo, Chicago, Cincinnati, Kansas City, Milwaukee, Sacramento, and Washington D.C. was compiled using Yardi Matrix data, and reflects only office and residential properties.
Information on prospective, planned, or current construction was compiled using Yardi Matrix data, and the numbers reflect total office square footage and total residential units as of February 2018. We considered the property status as follows: “property status: under construction” reflects property on which construction is actively being carried out; “property status: planned”—project plans have approval, but construction is not yet being actively carried out; “property status: prospective”—project plans have been submitted, but are still pending approval.
We also conducted a nationwide survey of 1,549 individuals living and/or working in these same 25 cities. We asked what they want to have built in their city’s urban core, what they feel the city needs most at this time, and what they feel would be the most beneficial transportation development or improvement. The response format allowed for a maximum of three choices from the options provided, as well as the choice to enter a separate suggestion in the “Other” field. The survey was conducted online, from February 14th to March 26th, 2018. Respondents were 55% female and 45% male, and fell into the following age groups: below 25 years (31%), 26 to 35 years (22%), 36 to 45 years (15%), 46 to 55 years (12%), 56 to 65 years (15%), and over 65 years (6%).
Which US CBDs House the Highest Infill Potential?
There have been very few national studies of urban vacant lots, and not for lack of effort. Widespread inconsistencies in property classification and data management make it very difficult to put together a comprehensive record. While each study managed to shed some light on how much of America’s cities was vacant lots and abandoned structures at the time of the research, they were vastly more useful in cataloguing the various bureaucratic disparities that hinder the very accuracy of such inventories. Today, urban planning policies, practices, and record-keeping still leave a lot to be desired.
Looking at just the 25 central business districts included in our study, we found that vacant lots sized 0.5 acres or more amount to a total of 584 acres—that’s urban core property with no improvements, that could fill roughly 442 NFL-standard-size football fields. We also uncovered that some of the least dense urban cores have seen the slowest development activity during the past five years, while developers have been significantly busier in the more tightly packed city downtowns.
Our research showed that major metros in the South, West, and Southwest harbor the most vacant lots in their urban cores. While it is not surprising that these cities have utilized the advantages of spacious geography to expand their boundaries outward, it invites the obvious question: why sprawl, if there is still plenty of potential to reinvest in the city core? The answer to that may be more complex than we can approach in this one article, but what we can do is look at the numbers.
In the South, Texas is king—208 acres of undeveloped land are scattered across the central business districts of Dallas, Austin, San Antonio, and Houston. The least dense CBD in Texas, as well as on our 25-city list, is Dallas, with vacant lots in the urban core adding up to 86 acres. During the past five years, 8.5 million square feet of property has been built in the Dallas central business district—second only to construction activity in NYC, recent Dallas developments included housing, office space, parking, retail, and hotels.
The world-famous entertainment scene that sprawls in the Mojave Desert, brimming with urban development potential, landed second on our list. With 75 acres of vacant lots in its urban core, Las Vegas has one of the least dense central business districts in the country. By stark contrast with the active Dallas landscape, and despite an estimated 8% increase in population since 2010, research shows that property completed here in the past five years was limited to office space and amounted to less than 100,000 square feet, with none currently under construction, and roughly 750,000 square feet more in commercial projects that are either only planned or approved and not yet built.
Austin rounds out the top three, with nearly 71 acres in vacant, unimproved land parcels that are located within its central business district. Texas’ Capital City is one of the country’s fastest growing local economies. Since 2013, over 2 million square feet of new property has been built in the urban core alone. According to our research, over half of this was hotels, with housing, office space and parking structures taking a back seat. Although the city’s 2011 Downtown Plan acknowledges the locals’ increasing desire for sustainable downtown living, and although prime undeveloped land is still available, construction has been somewhat stifled by regulations that do not accommodate modern urban development needs. Perhaps when Austin runs out of city-owned, whole-block-sized parking lots to hand over, urban planning policies and practices will get a much-needed reexamination.
The country’s most active commercial markets, NYC and Chicago, are neck-and-neck in the middle of the list, each home to roughly 17 acres of downtown vacant lots. Construction-wise, development in New York City during the past five years far exceeded activity in any other U.S. central business district—nearly 30 million square feet of property was built here since 2013. That’s three and a half times more than in Dallas, without the comfortable option of a sprawling suburban expanse. Chicago lands third on the list of cities with most development in the last five years—nearly 7 million square feet of new property was completed in the Chicago central business district since 2013, and there was an almost 50-50 split between housing and office space.
One may reasonably expect the largest, busiest cities to have maxed out their infill potential. And, while Los Angeles and Washington D.C. do closely fit the bill, having less undeveloped urban land than Chicago and NYC, our research shows that the densest U.S. urban cores are actually Tampa, Fla., Sacramento, Calif., Buffalo, N.Y., Kansas City, Mo., and Milwaukee, Wis.
Wisconsin’s Brew City has been the most active of the five in terms of urban core development, which was not held back by the relatively stable population count since 2010—developers have built just over 2 million square feet of new office (76%) and residential (24%) property in downtown Milwaukee since 2013.
Kansas City, Mo., has seen 1.7 million square feet of new residential construction completed here in the past five years. According to U.S. Census Bureau estimates, the local population has grown by 5% since 2010.
Tampa, home to the densest U.S. CBD on our list, has an admitted urban sprawl problem. Tampa City proper has seen a population increase of 12.3% since the start of the decade, and, with just over 6 acres of urban land left undeveloped in its urban core, the city is running out of space to build anew. This might explain why one of the country’s major local economies has seen just 640,000 square feet of new urban core construction in the past five years.
While developers are busy growing U.S. city’s commercial real estate inventories, businesses and investors alike can explore great office deals from all major U.S. markets with CommercialCafe.com:
As the Great American Economy Continues to Grow, the Need for Housing Remains the Primary Pain Point
In our efforts to get a feel for the direction urban planning and design should take, we conducted a 25-city survey, in which we asked 1,549 individuals living and/or working in these locations what developments they want to see in their city’s downtown, as well as what projects their city needs most right now. The number one issue on everyone’s mind was crystal clear—the need for housing.
When asked what developments they want in their city, 72% of respondents chose housing and homeless shelters. These choices went up to 83% when respondents were asked what they think their city needs most. Many respondents also mentioned the need for not just any type of housing, but for affordable housing. According to information released by the U.S. Census Bureau, growth of the national housing stock was below pre-2007 levels in nearly all states, and the total number of residential units had reached 135.7 million as of May 2017.
There are few who’d deny that more urban housing, affordable urban housing, is of utmost necessity at a time when rising rental rates are pushing working Americans out of the cities, or completely out of a home. Last year, the nation’s homeless population increased for the first time since 2010, apparently nudged upwards by the worsening situation in major cities like Los Angeles and New York. When looking at the numbers, it sure seems as though the local economies are working towards catching up with the demand, but perhaps not working hard enough. In addition to slowing growth of the national housing stock, the better part of what is being built is far from affordable.
Los Angeles has seen nearly 5 million square feet of new property completed within its central business district since 2013, and 3.3 million square feet was housing. There are roughly 6,200 residential units currently under construction in L.A., and plans for 6,900 more have been submitted to the city and are awaiting a stamp of approval. Even so, Los Angeles remains the home of the “biggest single group of unsheltered people in any U.S. city.”
Out of the 30 million square feet of NYC construction completed during the past five years, almost half was non-commercial. As of February 2018, 4,987 residential units were under construction in NYC, plans for 4,946 more had been green-lighted, and 1,600 others had been submitted with the city and were pending approval. Furthermore, while the Big Apple fares better than L.A. in terms of sheltering the homeless, its streets remain home to the largest homeless population in the country.
Among the top 10 U.S. cities with the most homeless people is also Las Vegas, which encompasses the country’s second-largest combined acreage of undeveloped urban core land. Las Vegas housing development over the past five years was virtually non-existent. Less than 250 residential units were under construction here as of February 2018, while 978 more had been approved and plans for 457 others had been submitted and are awaiting a verdict.
Everyone Wants to Live in ‘Walkable’ Cities, but Does the Local Infrastructure Allow It?
Our nationwide survey also aimed to find out how people working and living in these 25 cities would prefer to get around. We asked our respondents what they think is the transportation development or improvement that would be most beneficial in their city’s CBD.
It turns out that most Americans would rather walk. Walkability was the top choice of most beneficial transportation improvement, overall, across the 25 cities we surveyed. In the few cases where it was not number one, it still ranked in the top three. NYC, Buffalo, and San Jose respondents showed a stronger preference for expanded coverage of subway transport. Dallas and Tucson locals indicated they would rather ride a bike than walk, take the bus, or drive, while Milwaukee residents put fixing the roads above improving walkability.
Our survey showed that Americans are embracing more sustainable transport options across the board, as public transport and ride sharing ranked high among popular preferences. The need for a more comprehensive network of EV charging stations was expressed by an average of 10% of survey respondents from all 25 cities. Moreover, of the 3% of overall respondents that advanced their own suggestions regarding local transport improvements, we note a few Washington respondents’ desire to see special routes for driverless cars in the central business district, along with opening up car-free pedestrian blocks that would promote community and commerce. One Milwaukee survey subject specifically called for Elon Musk to build “tube transportation” there.
However, America’s infrastructure problem runs too deep for an easy fix. The latest report card graded by the American Society of Civil Engineers said “D+” and urban sprawl has a lot to do with it, as the asphalt network that sprawled American cities has become a burden. The cost of roads merely begins with their construction. Ever-expanding cities mean more roads, more cars doing longer commutes, more wear and tear on the infrastructure, as well as on maintenance budgets, which tend to always be stretched very thin.
America’s ever more expensive infrastructure problem is an urban sprawl problem, and the densest entry on our list is a perfect example of all of that—Tampa’s expanse is out of control. The strain of sprawl on public, as well as personal resources is so intense, that local officials have even come to consider enacting “mobility fees” that would at least discourage construction of new roads and keep development within the confines of existing infrastructure. Within the past eight years, Tampa has fared poorly on several scales. The average household in the metro area spends over 50% of their budget on housing and transportation. According to Salon, the city is among the worst for commuters, has been rated the second-most dangerous U.S. city for pedestrians, and has virtually no walkable destinations. Given that not much has had a chance to change since that 2012 assessment, it’s no wonder that the top choices expressed by our Tampa respondents in terms of what they want more of in downtown Tampa were parks, housing, and schools—they want room for a life downtown. When asked what they feel would be the most beneficial transportation development or improvement, 50% indicated infrastructure upgrades as the number one desired investment, followed by increased walkability (a choice expressed by 48% of Tampa respondents), and bike lanes (35%).
The vibe that Floridians would much rather ditch the cars and traffic congestions also rang true in Miami, where respondents indicated they want improved bus transport, better walkability, and more bike lanes (in that order). The top choice of Orlando locals that participated in our survey was improved walkability, followed by the desire for infrastructure upgrades and a subway transport system.
Of course, in cities that were designed more around cars than around people, “walkability” is still much easier said than done. So, if it’s not yet possible to narrow down streets, insert miles of bike lanes, and widen (or, in some cases, build) sidewalks, maybe use undeveloped CBD parcels to build parking structures and start to clear a walking path. It’s time to escape America’s parking paradox: even though most municipalities require that new development also provide a zoning-designated minimum amount of parking, it still never seems to be enough, and yet it’s mostly sitting empty around event venues, retail centers, and workplaces.
While a parking space is never there when you need it, somehow our cities have more parking than is necessary. Take Los Angeles for example—the area taken up by L.A.’s notoriously car-centric, county-wide sprawl is 14% parking. The city’s central business district reportedly has a total of 260,000 off-street parking spaces per square mile, yet drivers end up spending 85 hours in a year looking for a place to park. Transit-oriented development combined with parking minimum requirements ended up discouraging people traveling downtown from using public transit, walking, or biking.
This cumbersome redundancy becomes even more of a burden as levels of car ownership decrease. As Millennials’ rejection of car culture fuels the successful disruption of the auto industry by ride-sharing companies like Uber and Lyft, urban planners may want to rethink transport and vehicle storage strategies.
Our research showed that just under 3 million square feet of parking structures were built since 2013, and the distribution across the 25 CBDs included in our study is far from even. Atlanta survey respondents placed infrastructure upgrades and subway transport in their top three preferences, after walkability.
The need for downtown parking space was echoed by some of the local real estate experts we interviewed. Tumesha Tarrant, commercial property management expert with the Braden Fellman Group, conveyed that the lack of parking and green space is notable in the Atlanta central business district. Commercial Broker Shaun Goldie of The Wesley Co., seconded the need for parking decks, as well as a subway running East – West.
The most productive location in this respect was Houston, where parking structures encompassing roughly 861,000 square feet were built downtown since 2013. Less than 15% of survey respondents indicated a need or desire for more parking structures in the urban core. Paul Martin, architect and president of Urban Architecture Houston, conveyed that the Houston CBD “needs a master plan to make a more cohesive finished product—inclusion of pedestrian areas, better handling of vehicle circulation and parking, a thread of parks both large and small to connect the buildings with walkways.”
D.T.L.A. was second on our list, with approximately 798,000 square feet of new parking structures built since 2013, followed closely by the 780,000 square feet completed in downtown Dallas during the same time.
Back to the Drawing Board—a Blank Page is a World of Possibilities
It’s beginning to look a lot like suburbia is not the dream anymore. Rather than spreading far and wide, people wish to come closer together and long for sustainable, efficient, and compact urban design. There are many ways to go about this, and almost all of them command a change of attitude. Along with implementing better, more uniform policies to ensure that vacant land in urban areas is thoroughly catalogued, cities should consider programs that encourage the sustainable (re)use—be it permanent or temporary—of undeveloped city-owned property.
Possible solutions also include creating special redevelopment institutions that focus on identifying and assessing the potential of vacant property, making improvements to information systems and local planning strategies, as well as annexation and growth management policies and practices. If the day comes when all administrative paperwork is successfully moved to interconnected digital databases and everyone manages to agree on real estate type definitions, the full strategic potential of U.S. urban land lying vacant may be unlocked. Washingtonians may get their driverless cars and Elon Musk’s tube transport may be built in Milwaukee by then, too.


Ioana Ginsac
Senior Content Writer, Industry News & Reports
Ioana is a content writer who has been covering all-things-CRE (and more) for several Yardi network publications since 2017. You will find her byline regularly in industry news and market reports, but also on articles covering sustainable development, green urbanism, and innovation, all of which she has been passionately learning about for more than a decade. Her work has been referenced by publications including AmericanInno, Bisnow, BusinessInsider, Commercial Property Executive, Curbed, Fast Company, Forbes, GlobeSt.